Over the first week of my internship at One Analytics, I took the Domo Student Training Course and Domo Student Certification Exam. The course was an excellent introduction to the vast resources that Domo offers its users, and I highly recommend completing it if you’re a student who is currently working with or planning to work with Domo. Upon completing the course, you’ll find yourself confident in your abilities to tell extravagant data stories with Domo regardless of your previous experience.
Domo Student Training Course Overview
The Domo Student Training Course consists of 7 modules, with a grand total of 48 individual lessons throughout its entirety. The course is a combination of reading, videos, and hands-on assignments, with 13 practice datasets provided for students to use during these assignments. Students may also find short quizzes throughout certain lessons. Overall, the course took roughly 15 to 20 hours to complete.
Domo Student Certification Exam Overview
The Domo Student Certification Exam consists of 49 multiple choice questions and covers the entirety of the course. The exam requires a final grade of 80% or higher to pass. Should a student fail their first attempt, the exam allows for a single retake within one week of their initial exam session.
Course Content
Getting to Know Domo (Interface, Buzz, and Appstore)

The course begins with an overview of Domo’s feature-rich, user-friendly interface. Understanding how to successfully navigate the platform is essential before delving into your specific data needs.
This module also covers Buzz, Domo’s built-in communication tool. The course doesn’t include hands-on use of Buzz, but it still walks you through its practical applications and shows how to use it.
The final lesson of this section focuses on selecting, filtering, and deploying apps from the Domo Appstore. Within the Appstore, you can find connectors to pull data into your Domo instance as well as custom apps.
Understanding Data (Data Types, Tables, and Visualizations)

This module contains a singular lesson centered around data literacy. It explores different data types including numbers, strings, dates, datetimes, and Booleans. It covers how data types can be categorized (e.g. quantitative or qualitative data, metrics and dimensions, etc.). The module additionally walks through how data is stored in tables and the best use cases for different types of data visualizations.
Connecting Data (Connectors, Workbench, and Local Uploads)

The course explains that there are a multitude of ways to connect to Domo (pre-built connectors, Workbench, and local uploads). Although it covers all three ways, students will only upload local files throughout the course. The final lesson in the module discusses different dataset update methods.
Working with Datasets (Personalized Data Permissions)

The course briefly covers Personalized Data Permissions (PDP) which allow Domo users to provision access to cards and dashboards on a case-by-case basis.
Transforming Data (Magic ETL, SQL DataFlows, and DataSet Views)

The course then covers how to transform the data uploaded to Domo, with Magic ETL being the main focus. Magic ETL is an intuitive drag-and-drop interface that allows users to transform, aggregate, and combine data without any coding experience. The course provides opportunities to work with multiple datasets and practice many of the actions the Magic ETL interface allows.
This section also permits students to create DataFlows in Domo using MySQL, a database language that runs the Transform and Load pieces of ETL processing. Although the course does not go deeply into how to write SQL code, students can still learn basic syntax and gain an overview of how MySQL is used in Domo.
The module ends with covering DataSet Views, which is Domo’s spreadsheet interface transformation tool. The course explores filtering, grouping, aggregating, and combining data through this simple visual interface.
Creating Content in Domo (Analyzer and Domo Dashboards)

After data is transformed, the course introduces Analyzer, the interface in which users can create visualizations of their data. The course provides opportunities to explore and create charts, graphs, and maps through Domo’s Analyzer tool.
The course introduces Beast Modes, a tool to create calculations within Analyzer itself. Through many hands-on activities, the course provides excellent practice in creating Beast Modes.
The course additionally describes how to build Domo dashboards, but it doesn’t provide a hands-on opportunity to build dashboards.
Consuming Data in Domo (Card Interactions and Alerts)

This final module discusses card features, properties, and filters that aid users in effectively consuming the data that is being visualized. Additionally, the section covers dataset alerts, which allow users to remain up to date on how and when their data is changing. The course dives deep into the types of alerts available to users as well as the different methods in which they can be assigned and utilized.
Helpful Tips
1. Follow along in Domo.
For students taking the course, I recommend exploring on your own as you move through the lessons. Keep Domo open in a separate window as you progress through the course to follow along in real time, even when you’re not participating in a hands-on activity. After completing a hands-on activity, continue experimenting with the dataset or card to become more comfortable navigating Domo’s many capabilities.
2. Some content may be outdated.
It is also helpful to know that some small pieces of the course are out of date. Because Domo is constantly innovating, some practice datasets and portions of Analyzer have changed since the course’s creation. This does not impact your ability to complete the course, and the core concepts remain relevant.
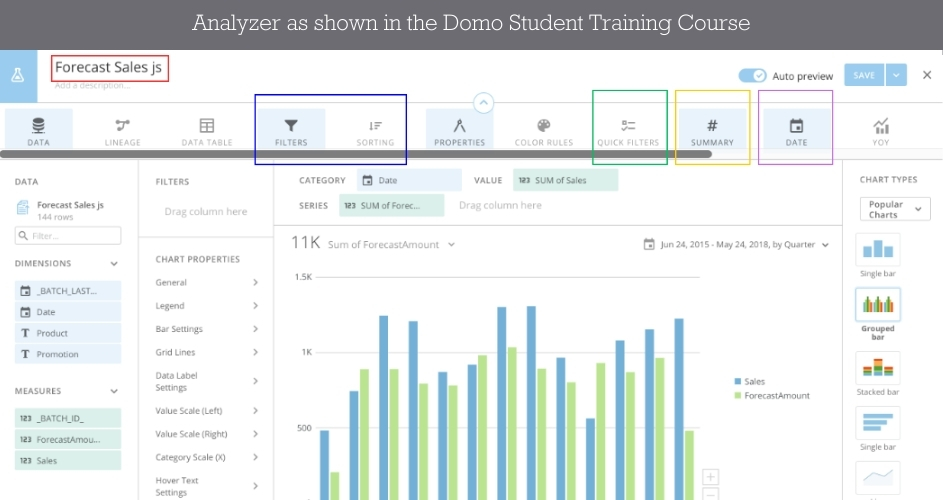
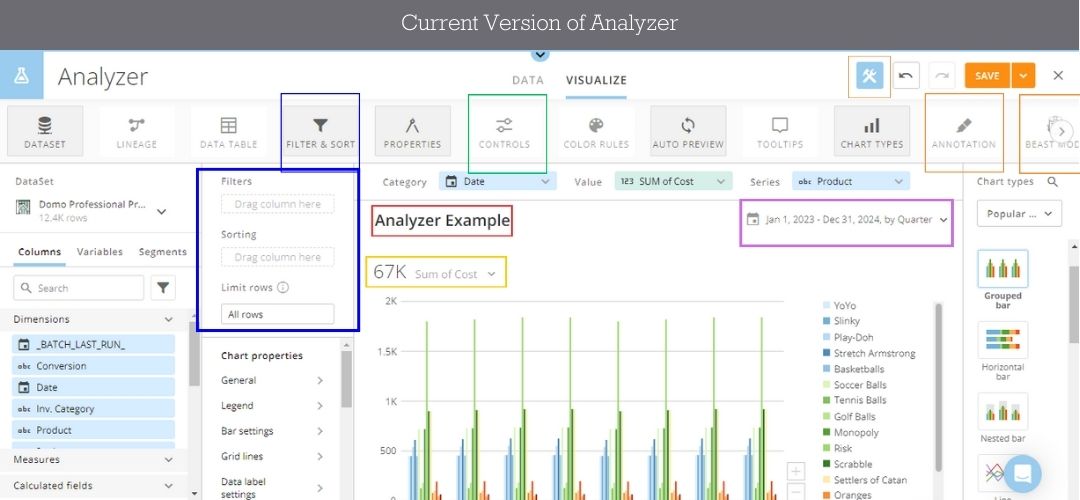
The biggest impact of these changes occur during the Analyzer activities. To help navigate these differences, I’ve included a comparison of Analyzer as shown in the Domo Student Training Course and its current version.


Here are the key differences:
- Card Title (shown in red): Previously, the card title was located in the upper left corner of the screen. In the current version, it appears above the summary number.
- Filter & Sort (shown in blue): These were once separate tiles but are now combined into a single tile.
- Quick Filters / Controls (shown in green): Quick Filters were previously their own tile within Analyzer. They can now be found under the Controls tile.
- Date (shown in purple): Previously, Date was a tile in the Analyzer toolbar. The date can now be formatted simply by clicking it above the chart.
- Summary Number (shown in yellow): Like the date, the summary number is now updated directly by clicking on it above the visualization instead of using a tile in the tool menu.
Additionally, the current version of Analyzer introduces several new features that were not available in the previous version. We’ve shown these in orange in the snips above. New additions include:
- New tiles have been added for Beast Mode and Annotation. Clicking the Beast Mode tile opens the calculated field editor, while the Annotation tile lets you add annotations to your visualization.
- A tool menu toggle has been introduced. Clicking the hammer and wrench icon in the top right of the screen will minimize the tool menu for a cleaner workspace.
These updates enhance functionality but do not change the fundamental principles covered in the course.
3. Learn about App Studio in other courses.
Finally, it is important to note that the Domo Student Training Course doesn’t cover App Studio, Domo’s low-code app builder, that allows users to create custom applications to visualize and interact with their data. Because this course doesn’t cover App Studio, I recommend exploring it in Domo’s App Studio Overview course or checking out our App Studio guide.
Conclusion
The Domo Student Training Course is an excellent way to familiarize yourself with the platform. It greatly benefits students wishing to learn more about Domo and the capabilities it provides.
Want to take the course? Sign up today! Looking for even more learning opportunities? Check out our favorite Domo University courses.
Interested in an internship working with companies that use Domo? Check out what a day in the life of a data analytics intern is like and the current opportunities at One Analytics.
Currently working for a company that uses Domo and could use some additional support? Check out our Domo consulting services.
Editor’s note: Ethan Eversole wrote the original version of this post in June 2024. Brigitte Bussiere updated the post in July 2025 to reflect the current course.

