Google Analytics 4 (GA4) is a powerful tool for understanding how customers interact with your website. While it excels at data collection, its native reporting interface can be less intuitive—especially when it comes to building and sharing visualizations. At One Analytics, we often bridge this gap by using Looker Studio to transform GA4 data into user-friendly dashboards. This approach ensures stakeholders have continuously updated insights, making data-driven decision-making easier and more effective.
What is Looker Studio?
Looker Studio (formerly Google Data Studio) is Google’s free data visualization platform. It allows you to pull in data from over a 1,000 data sources, including Google Analytics, Google Ads, BigQuery, YouTube Analytics, and more.
In Looker Studio, dashboards (called “Reports”) can combine data from multiple platforms into a single cohesive view. With 48 built-in visualization types and a user-friendly drag-and-drop interface, Looker Studio makes it easy to build customized insightful reports. A variety of prebuilt templates also help users of all experience levels get started quickly and tailor reports to meet stakeholders’ unique needs.
Steps to Set Up Google Analytics 4 Reporting in Looker Studio
To get started building a GA4 report in Looker Studio, follow these steps:
1. Sign in to Looker Studio
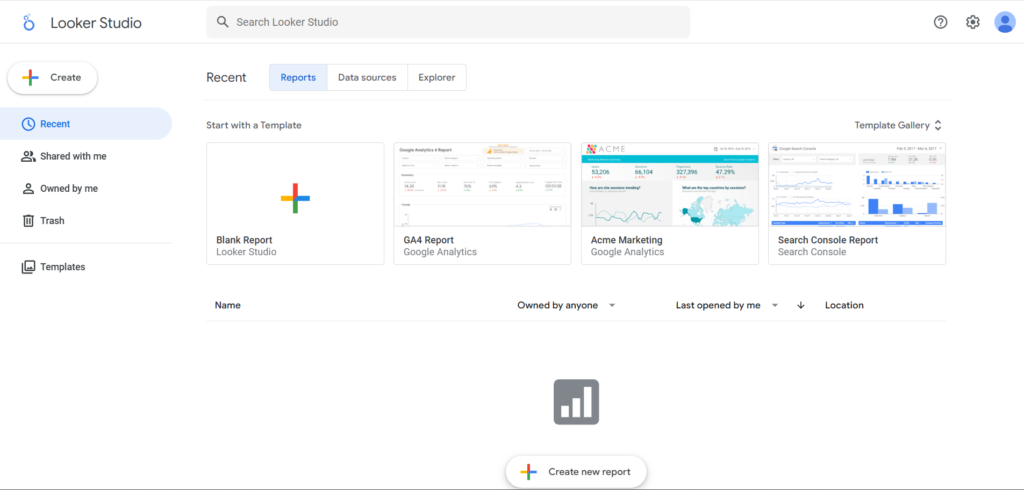
Navigate to Looker Studio. Sign in with a Google Account that has access to the Google Analytics 4 account and property that you want to pull data from. Once logged into Looker Studio, you will arrive at the home page.
2. Create a report
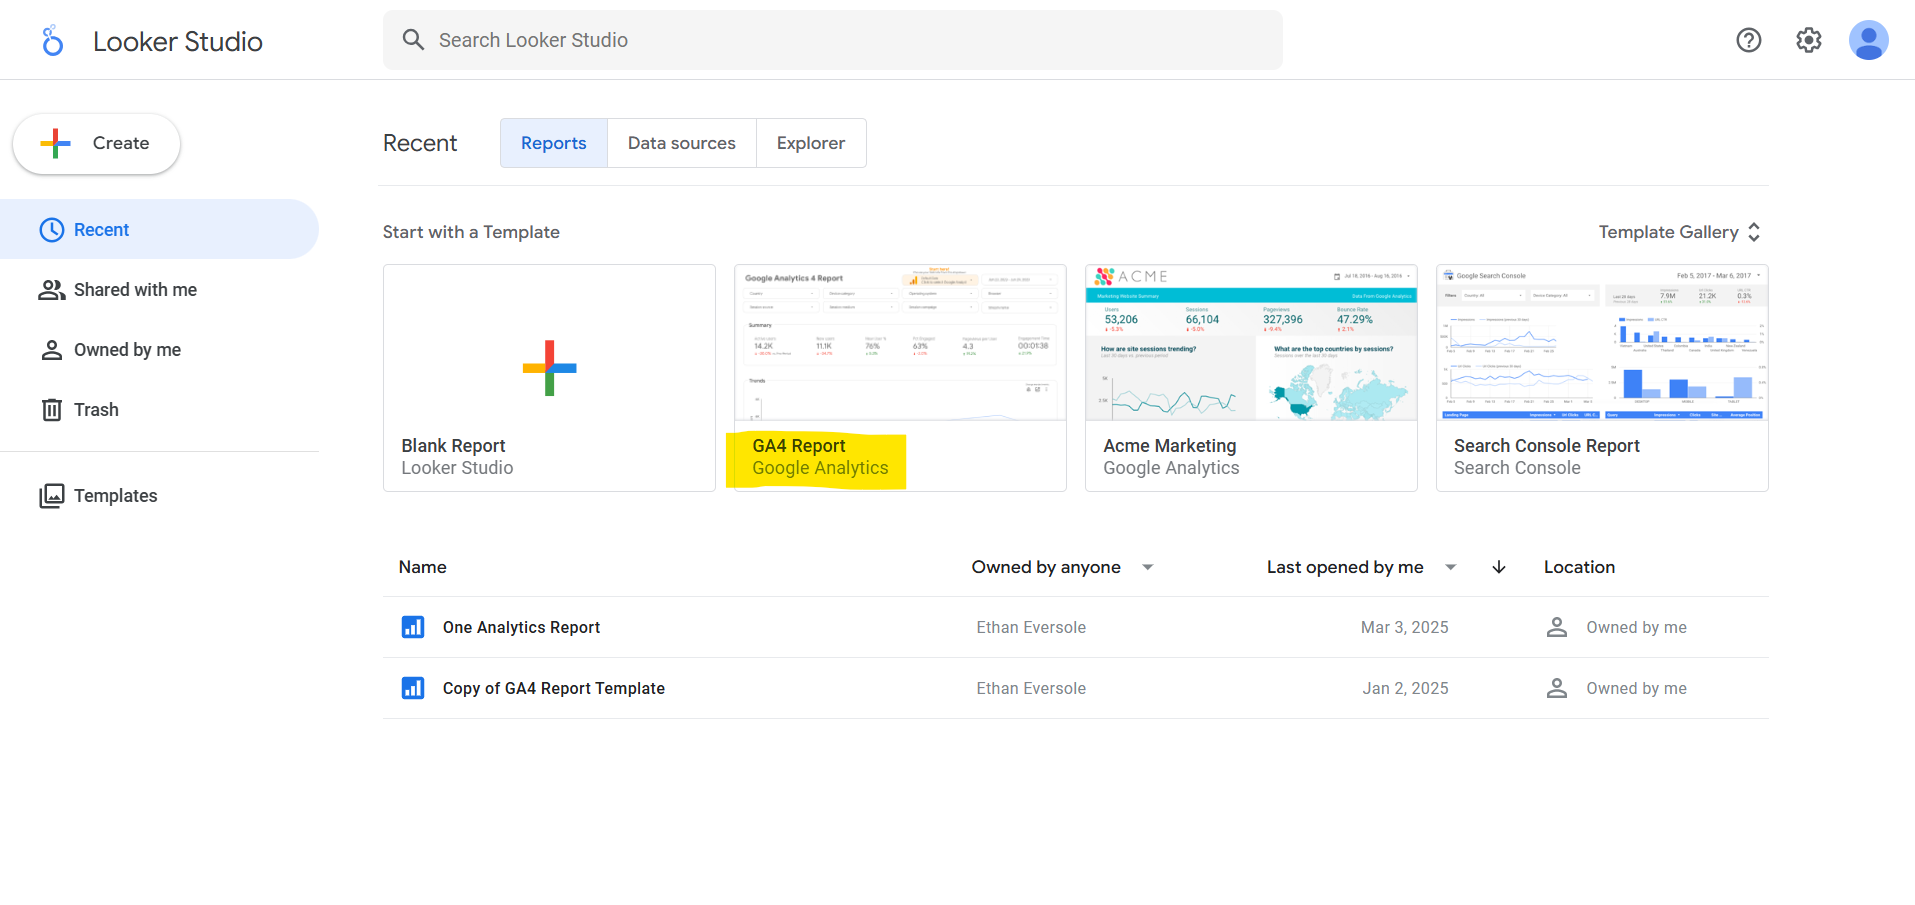
Start with a prebuilt report template. Looker Studio offers a Google Analytics 4 template titled “GA4 Report”, which is a great starting point if you’re new to the platform. To use it, simply click on the template.
3. Connect your Google Analytics 4 data
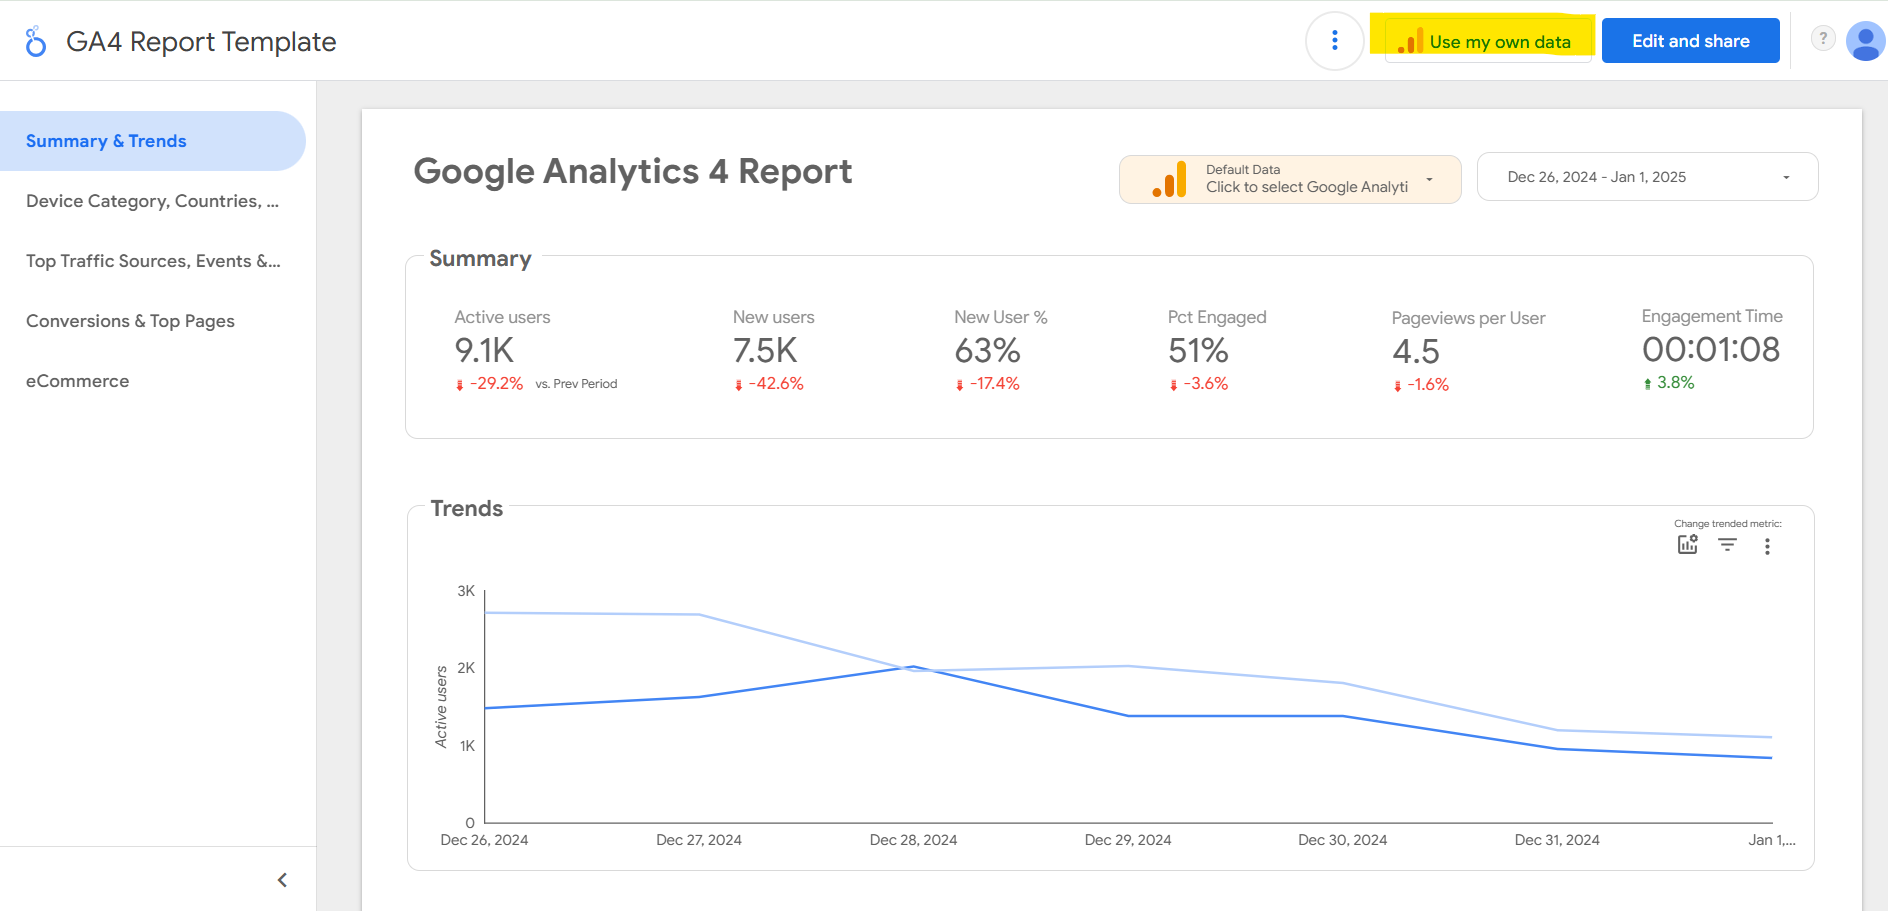
In the top right corner, select “Use my own data”.
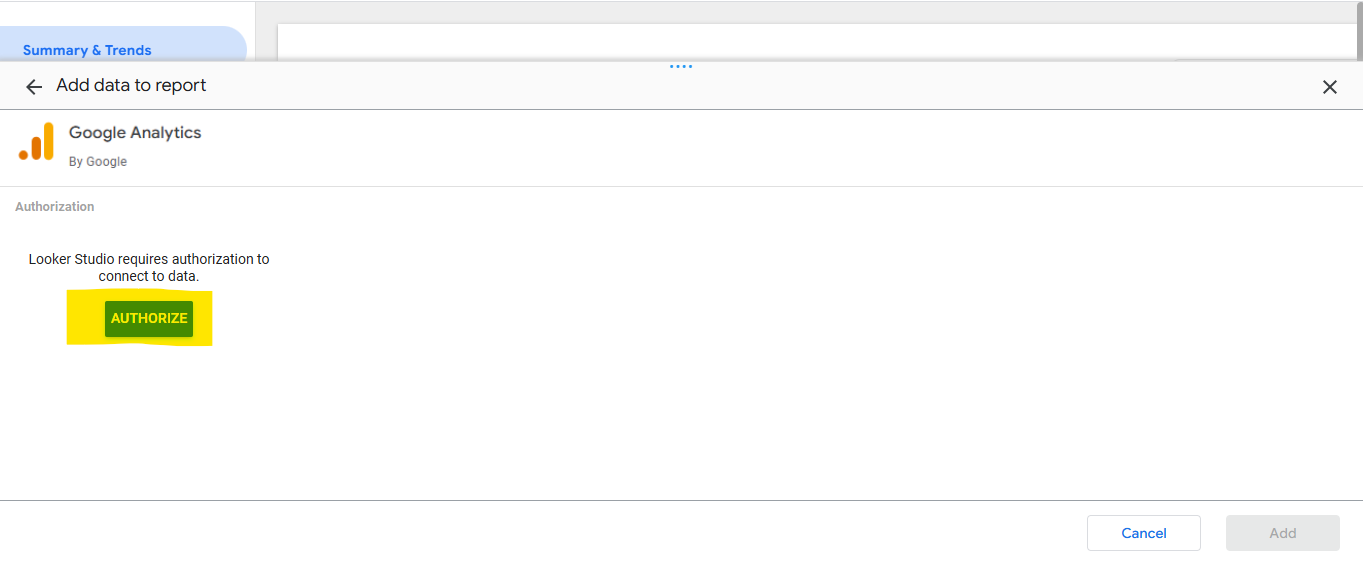
After selecting “Use my own data”, a new window will appear asking you to authorize Looker Studio to connect to your Google Analytics accounts. Click “AUTHORIZE” and proceed through the additional authentication steps.
You will then select the GA4 account and property you want to view data from. Click “Add” in the bottom right corner of your screen.
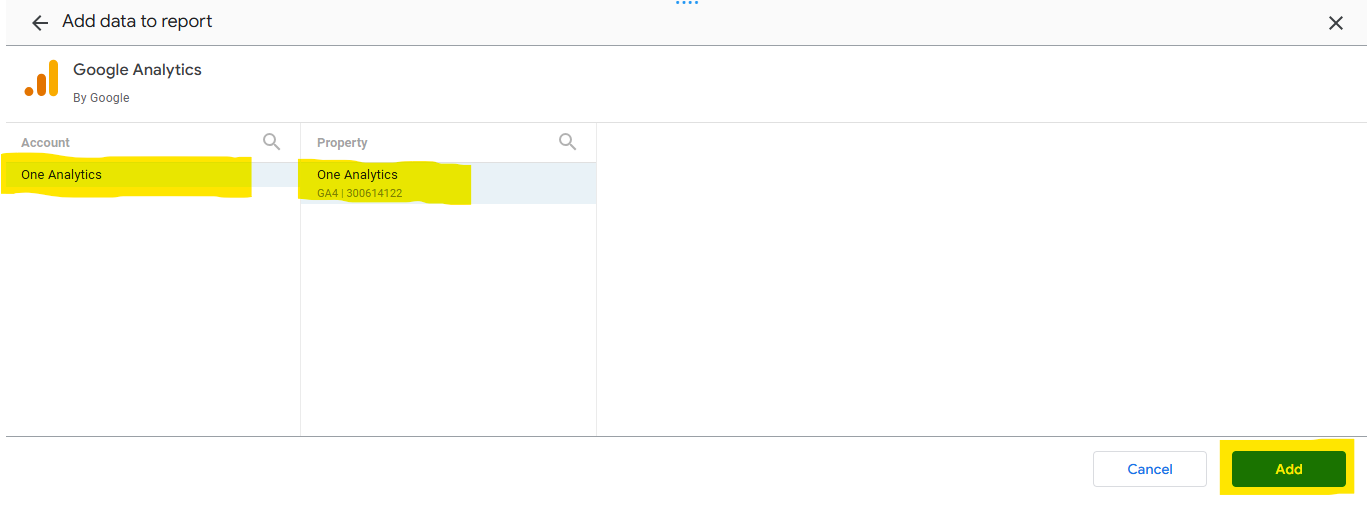
A window will open letting you know that you are about to add data to the Looker Studio report. Click “ADD TO REPORT” to proceed.
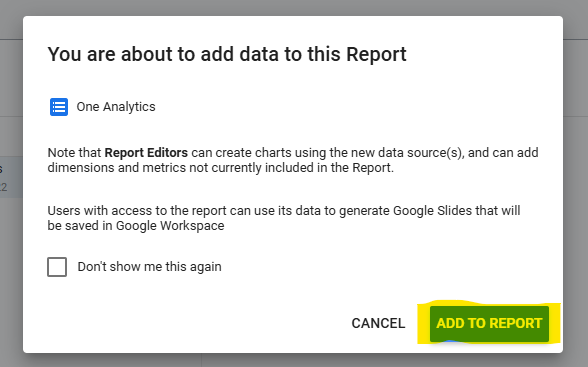
Your data is successfully connected to Looker Studio! Your data should automatically populate the charts and tables provided.
3. Validate your data
After adding your data, compare the information in Looker Studio with the data shown within your GA4 property. Remember, data updates in Looker Studio can take between 1 to 12 hours. If you notice any discrepancies, allow some time for the data to refresh before making adjustments.
4. Customize your report
Now it’s time to make the report your own. Explore the 48 available visualization types to create charts, graphs, and tables that resonate with your stakeholders. Use features like filters, calculated fields, and data blending to tailor the report to your specific goals and surface the insights that matter most.
Conclusion
Looker Studio is a powerful tool that unlocks the full potential of your GA4 data, enabling you to create visually compelling, easy-to-share reports. Ready to turn your GA4 data into actionable insights? Start building Looker Studio reports today, and experience the impact of customized data visualization.
Need help getting started? Explore our Looker Studio consulting services to see how we can help you build clear, impactful dashboards tailored to your business goals.

