Metabase and Domo are both popular business intelligence (BI) platforms. However, each offers different capabilities for getting the most out of your data. Because every data project has different requirements, you should know about the relative strengths of each platform before you begin your data journey.
Are you struggling to determine which platform is right for you? We’ve assessed their capabilities below.
Connecting Data
To pull data into Metabase, you’ll first need to store your data in a database (e.g. Snowflake, BigQuery, CSV file, etc.) that you will connect to Metabase. There are currently 28 database connectors that are available within Metabase. You may require an intermediary tool like Supermetrics or Fivetran to move data from where it resides (e.g., a CRM, advertising platform, etc.) into a database.
Alternatively, Domo allows you to connect directly to where your data resides, whether that’s your CRM, advertising platforms, or a database. Domo has over 1,000 pre-built connectors in the Domo appstore, and the list continues to grow. If you can’t find the connector you’re looking for, Domo additionally allows for alternative connection methods including the building of a custom connector, uploading files, and importing email attachments.
Cleaning & Combining Data
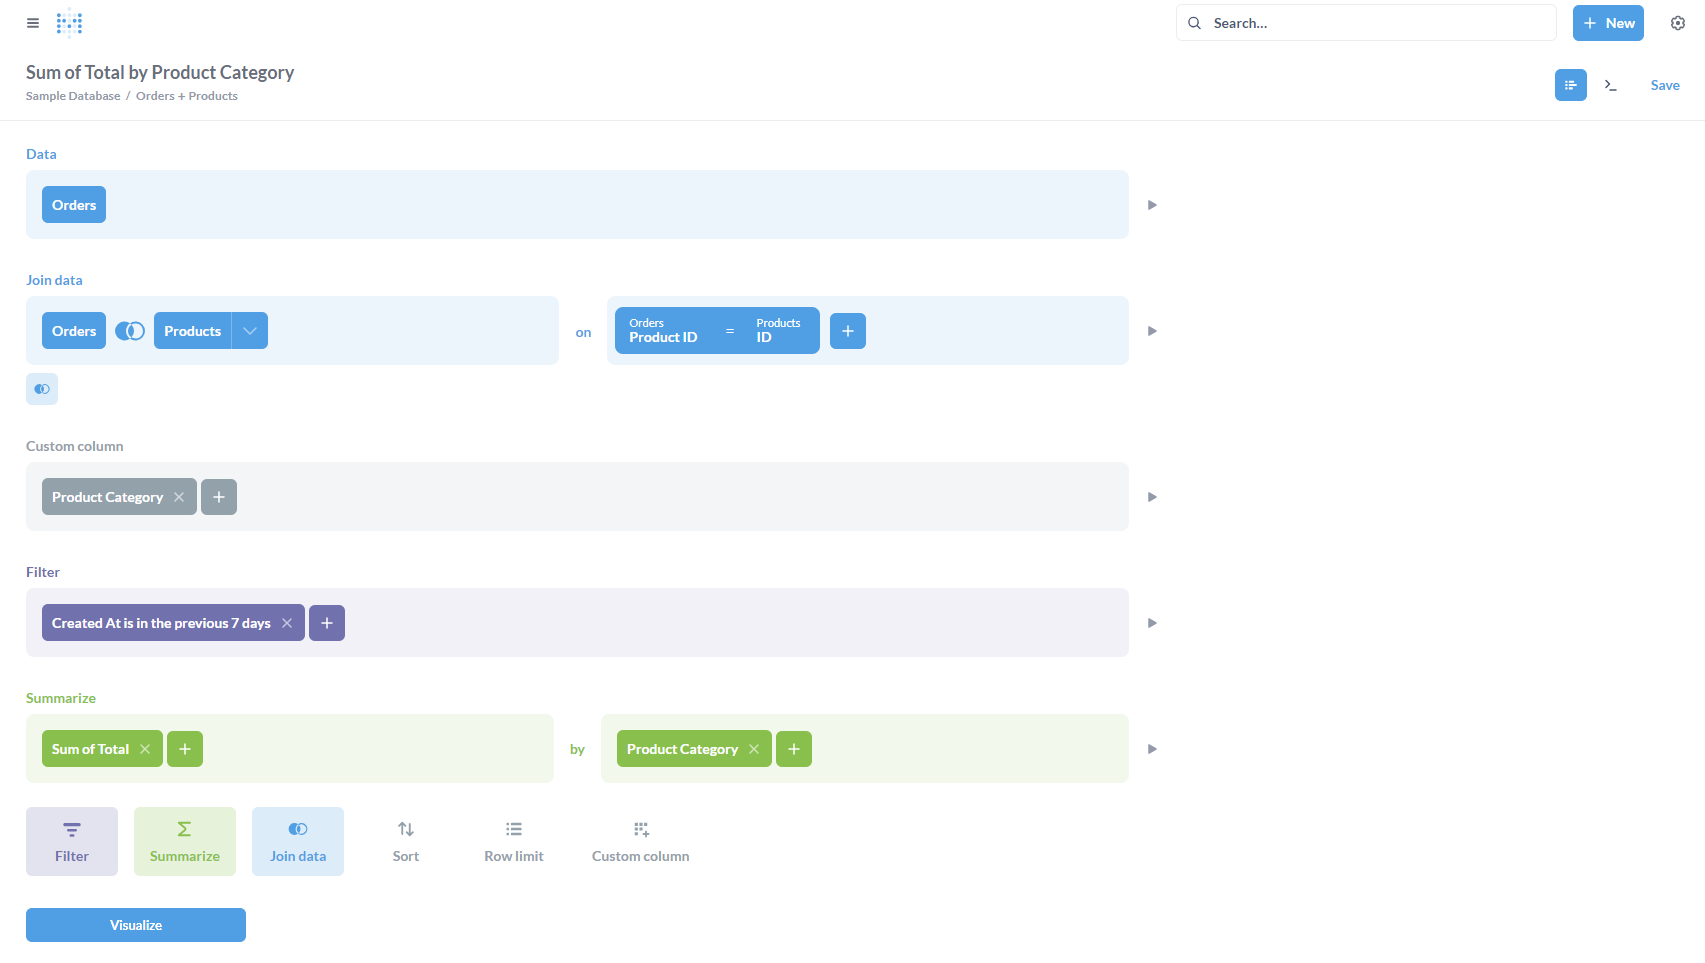
Once data has been connected to Metabase, you can clean or combine the data by creating a Metabase Question or SQL Query. Within a Metabase Question, you can join datasets, create custom columns, apply filters, sort your data, and aggregate metrics by the dimensions of your choosing. The Question interface (shown in the image below) is easy to understand. However, for complex tasks, you may end up needing to create multiple rounds of questions to properly clean and combine your data. For more complex cleaning and combination efforts in Metabase, it is best to create a SQL query which requires knowledge of SQL.

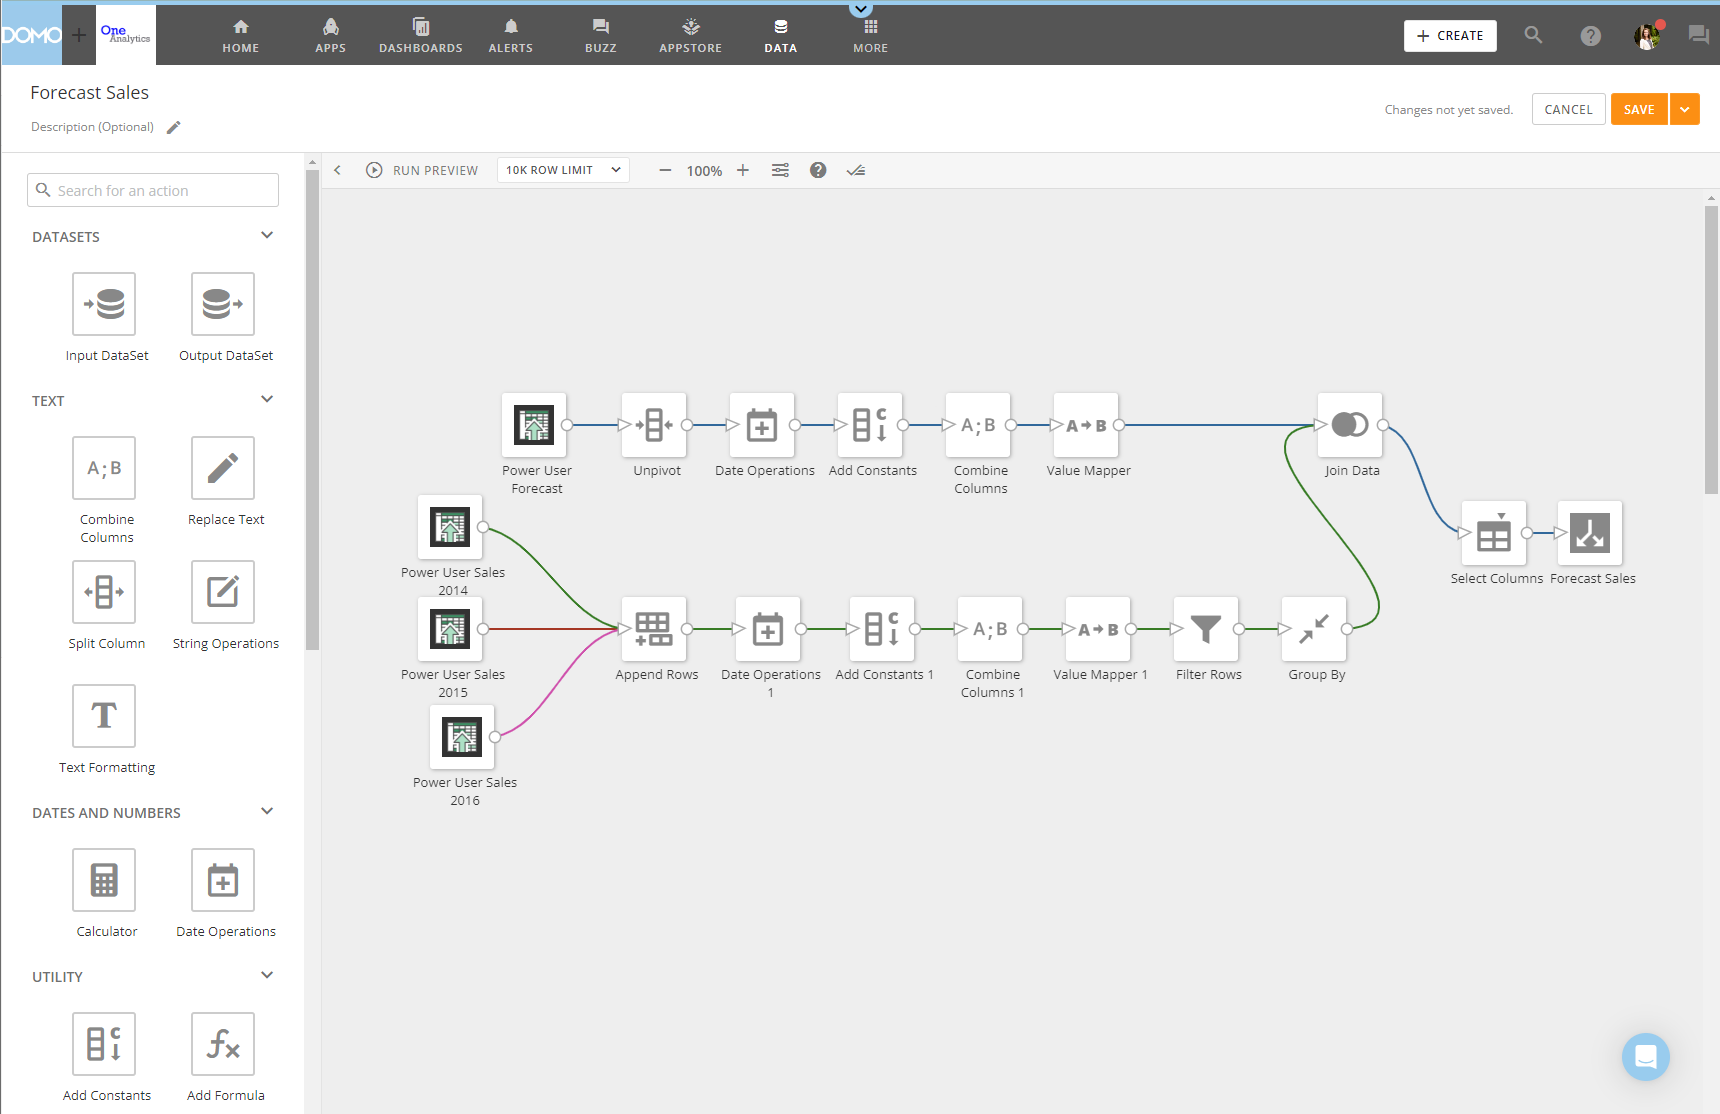
Like Metabase, Domo offers the ability to create SQL queries to manipulate your data via the MySQL tool. However, for those who are attempting to do complex data transformations without significant SQL coding, Domo’s Magic ETL tool will allow you to clean and combine your data efficiently and effectively. Domo’s Magic ETL (shown in the image below) is an interactive, drag-and-drop interface that requires no coding knowledge. You can input the datasets you want to work with, make any desired changes (e.g. appending or joining data, creating custom calculations, filtering data, etc.), and output the result as a new dataset. If you want to code within Magic ETL, you can use the Python and R tiles.

Visualizing Data
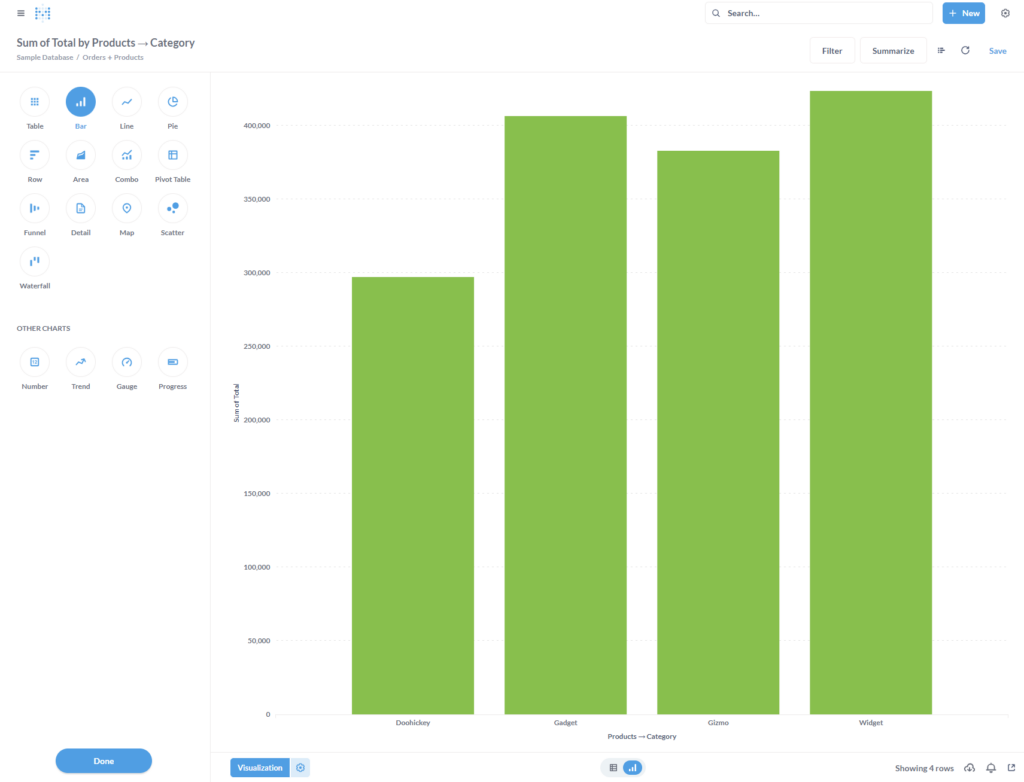
Metabase offers a variety of visualization types. Within the visualization interface (shown in the image below), you click on the type of visualization you’d like to use, and Metabase will display the result. Each can be customized with axis labels, scale, and colors. Visualizations can be created quickly and then added to a dashboard within Metabase or exported for use elsewhere.

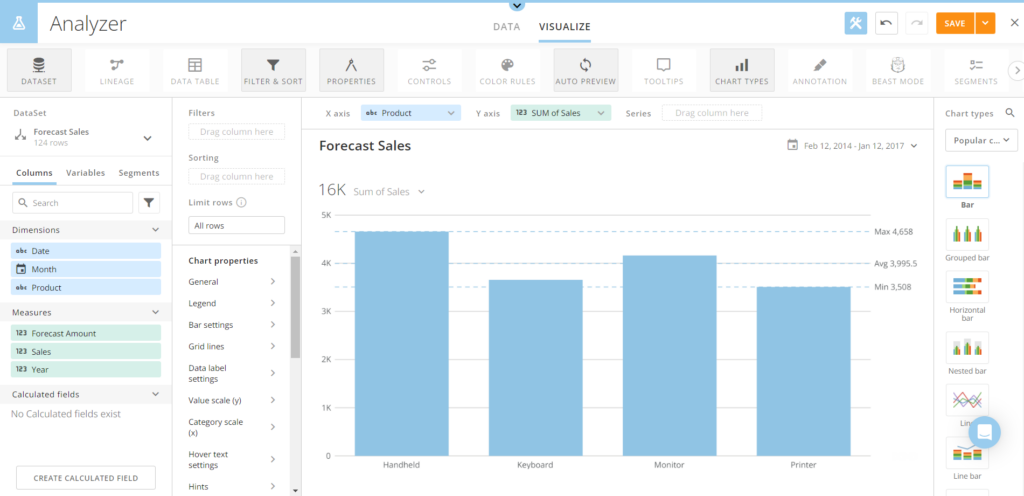
Domo offers a wider variety of visualization types. Domo’s visualization interface, Analyzer, allows you to drag-and-drop the data you want to display, select your visualization type, and fully customize the resulting chart. If the visualization you want isn’t available, you can make your own visualization type as a custom chart.

Analyzing Data
Once data has been cleaned and is ready for analysis, Metabase allows you to combine your visualizations into dashboards. Metabase dashboards are easy to create, navigate, edit, and share with stakeholders. Because of this, data can be ready for analysis at a moment’s notice.
Similarly, Domo allows you to present your data in dashboards that are easy to create and share. In addition to its dashboard capabilities, Domo also provides a multitude of data science tools. Within Magic ETL, Domo offers 6 data science tiles including: Classification, Clustering, Forecasting, Multivariate Outliers, Outlier Detection, and Prediction. You can also use your own Python and R scripts to conduct analyses in Magic ETL.
Price
Metabase offers two ways to deploy Metabase: self-hosting or cloud-hosting. Self-hosting will likely require you to have support from your organization’s IT team. However, Metabase does offer a free version if you are able to self-host. Alternatively, Metabase offers paid cloud-hosted plans starting at $85/month. You should additionally consider the cost of any additional tools that will be required to complete your project within Metabase. For example, will you need to purchase a database, connection tools like Fivetran or Supermetrics, etc.?
Domo uses a consumption-based pricing system. You receive a certain number of credits (based on your plan) and use those credits to store, ingest, and transform data. Domo offers a 30-day free trial that allows you to test out the platform and see if it fits your needs. The trial doesn’t require a payment method. After the trial, you can contact Domo’s sales team to find a consumption plan that works for you.
All pricing information is accurate at the time of this post. For full updated details regarding Metabase pricing, please refer to Metabase’s website. For full updated details regarding Domo pricing, please refer to Domo’s website.
Conclusion
In summary, Metabase is a great tool for making quick visualizations, and putting together simple, effective dashboards. However, complex data solutions may become difficult to accomplish.
On the other hand, Domo was designed with customization in mind and is well-suited for tackling complex data problems. With Domo, you have full control of your data journey from the moment it arrives on the platform to the moment you share it with end users.
We recommend using Metabase if:
- You are looking to connect to data in a pre-existing database.
- You don’t need to do significant data cleaning / combination OR you love working in SQL.
- You don’t need a wide range of visualizations.
- You don’t want to conduct in-depth analysis and data science efforts within the platform.
- You want a self-hosted solution.
We recommend using Domo if:
- You are looking to connect to data wherever it resides (e.g. your CRM, advertising platforms, or a database).
- You need to do significant data cleaning / combination.
- You want a wide variety of visualizations (including custom visualizations).
- You want to conduct in-depth analysis and data science efforts within the platform.
- You want a cloud-hosted solution.
Want additional help deciding which BI platform is right for you or getting a BI platform implemented? We’re here to help. Check out our data analytics consulting services today!

