Google Analytics is a powerful tool for tracking user interactions on your website. However, it’s crucial to verify that the data you’re collecting within Google Analytics is accurate and complete. In this post, we’ll explore how to effectively use GA4’s DebugView to test your data collection and get real-time visibility into the data that is being captured by Google Analytics. By leveraging DebugView, you can ensure that your GA4 set up is working properly.
What is GA4 DebugView?
DebugView offers a real-time, minute-by-minute view of how Google Analytics records interactions as you preview and navigate your site in a debug session. This feature shows the exact data captured for each action you take, displaying both standard events and key events as they occur. DebugView is especially useful for testing events you’ve configured in Google Tag Manager or directly within GA4, as it lets you verify that GA4 is tracking each event accurately. It gives you an immediate view of the data GA4 collects from your interactions, helping you confirm that your setup works as intended.
How do I use GA4 DebugView?
Navigating to GA4 DebugView
Begin by logging into your Google Analytics account and property and navigating to the Admin section (represented by the gear icon in the menu on the left side of your screen). Once there, you’ll select “DebugView” from within the “Data display” section. You’ll then see the DebugView page. The video below shows visually how to navigate to DebugView within your Google Analytics account.
Starting a Debug Session
To see events take place within DebugView, you’ll need to start a debug session. You can do this within Google Tag Manager or with a browser extension.
We’ll walk through how to start a debug session in Google Tag Manager first. Navigate to the container that contains your GA4 tags. Once there, click “Preview” in the top right, enter your site’s URL, and click “Connect.” A new window will open with your site. You can then take actions in that new window and see how GA4 captures them within the DebugView screen. The video below walks through all the steps for starting a debug session in Google Tag Manager.
If you’re not using Google Tag Manager, we think you should be. Take a look at our blog post that explains some of the reasons it is an excellent tool to have at your disposal!
If you are still not convinced Google Tag Manager is for you, that’s okay. You can alternatively start a debug session using a browser extension. Using Chrome, add this extension to your browser. Once it has been added, navigate to your website. Then, click on the puzzle piece icon located to the right of your search bar. You should see the extension you added. Click the extension. If you reopen the extension window (by clicking on the puzzle piece icon), the icon for your extension should now say “ON” like in the image below.

You can then take actions on your site and see how GA4 captures them within the DebugView screen.
Viewing Debug Events
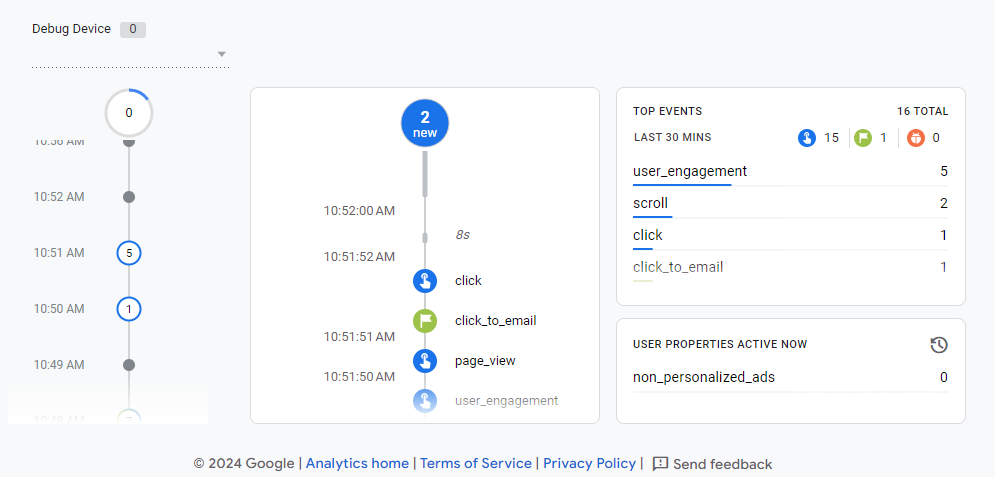
As you take actions within a debug session, you should see those actions appearing in the DebugView screen. In the center of the page, you’ll see a timeline. As events take place, they’ll be located on this line with their respective timestamp. Standard events will appear as blue circles, while key events will be green. The circle at the top of the timeline shows how many events have been recorded by DebugView but are not yet displayed on the timeline. To the right, there is a small window that notes how many events have taken place in the last thirty minutes.

Keep in mind that it sometimes takes a while before events appear in DebugView. If you don’t see them right away, wait up to 15 minutes before adjusting your tracking. Even when the event isn’t registered immediately, the provided timestamp will still match when the event actually occurred.
Be on the lookout for missing or duplicate events. Both suggest there’s a problem with your tracking setup that you’ll want to fix.
Viewing Event Parameters
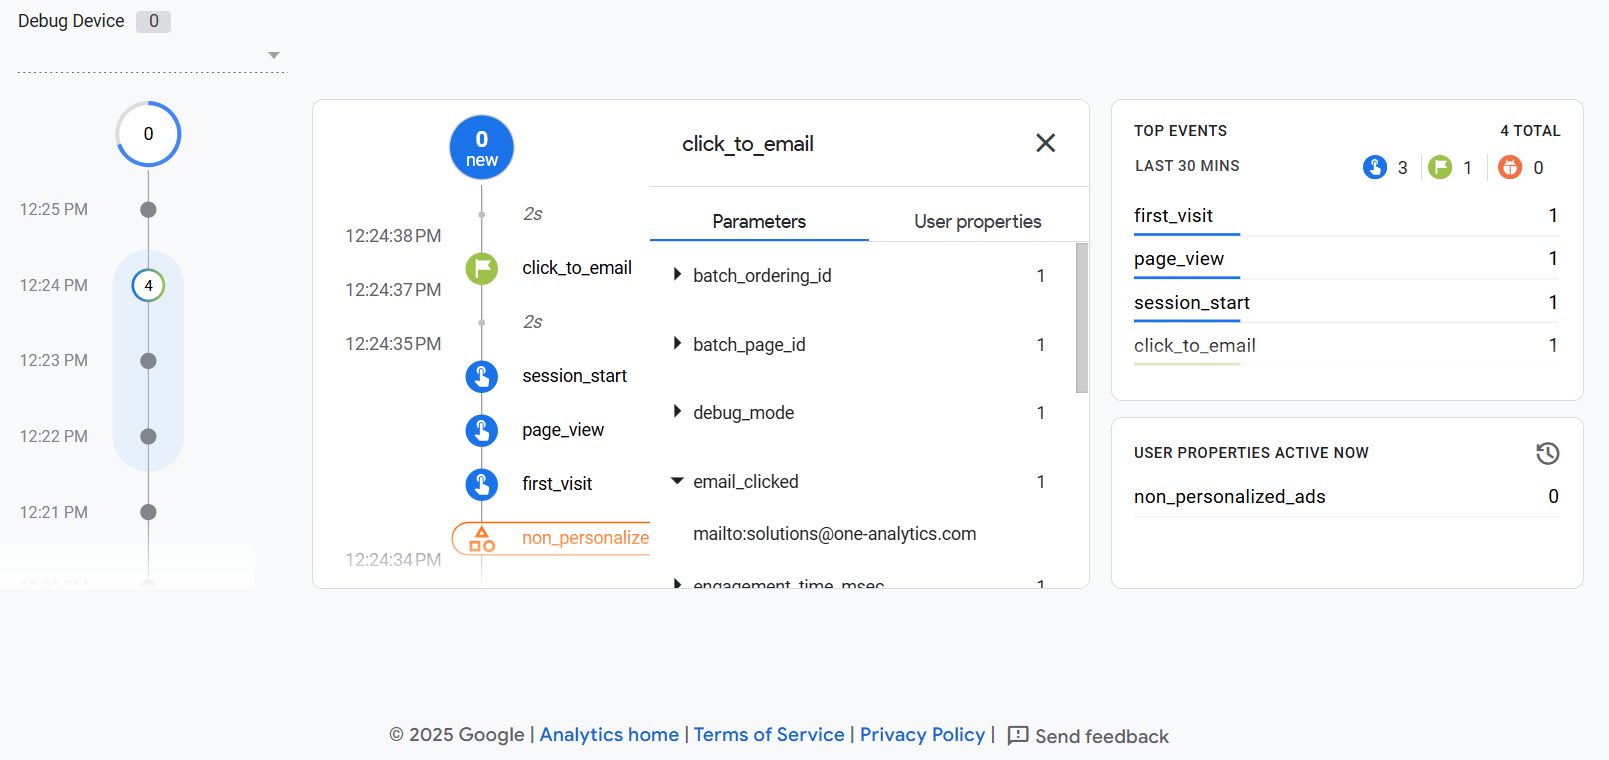
You can click into any individual event in DebugView to see more details. GA4 will show all parameters that were passed with that event, including standard parameters like “page_location” and “page referrer” as well as any custom parameters you’ve configured in Google Tag Manager or directly in GA4.
This view gives you a transparent look at the raw data GA4 is capturing, making it easier to verify that your implementation is working as intended.
For example, if we click into our “click_to_email” event, we can see that we are successfully passing a custom parameter, “email_clicked”, which shows which email the user clicked.

Tip: Filter Out Debug Traffic
When using DebugView to test your setup, it’s important to make sure that your test activity doesn’t end up skewing your GA4 reports. By default, GA4 records debug traffic like any other user activity, so repeated testing can inflate your numbers and mislead your analysis.
Google provides tools to help you filter out internal or developer traffic. For step-by-step setup instructions, check out Google’s guide to managing test traffic in GA4.
Conclusion
DebugView is a critical tool in ensuring that your GA4 data is accurate and actionable. Through the use of DebugView, you can see how GA4 represents interactions with your site and make necessary adjustments as needed.
Need more help setting up or interpreting GA4? Check out our Google Analytics consulting services today.

