Domo offers a multitude of tools for working with data. One of the most notable tools is Domo’s Beast Mode. Beast Mode allows you to create calculated fields within Analyzer, Domo’s visualization builder. They are easy to create and an incredibly helpful asset for any Domo user to have in their toolbelt.
What is Beast Mode?
Domo Beast Mode calculations are built from code within Domo’s Analyzer tool. The code is similar to SQL but was designed specifically to operate within Domo and to be more intuitive to users without coding experience. Some of the standard SQL functions aren’t supported when making Beast Modes. You can find a list of all available functions in Beast Mode here.
Common Beast Mode Calculations
It can be tough knowing where to begin to leverage Domo Beast Mode. Below we outline two common use cases for Beast Modes: Period-Over-Period Calculations and Categorization Calculations.
Period-Over-Period Calculations
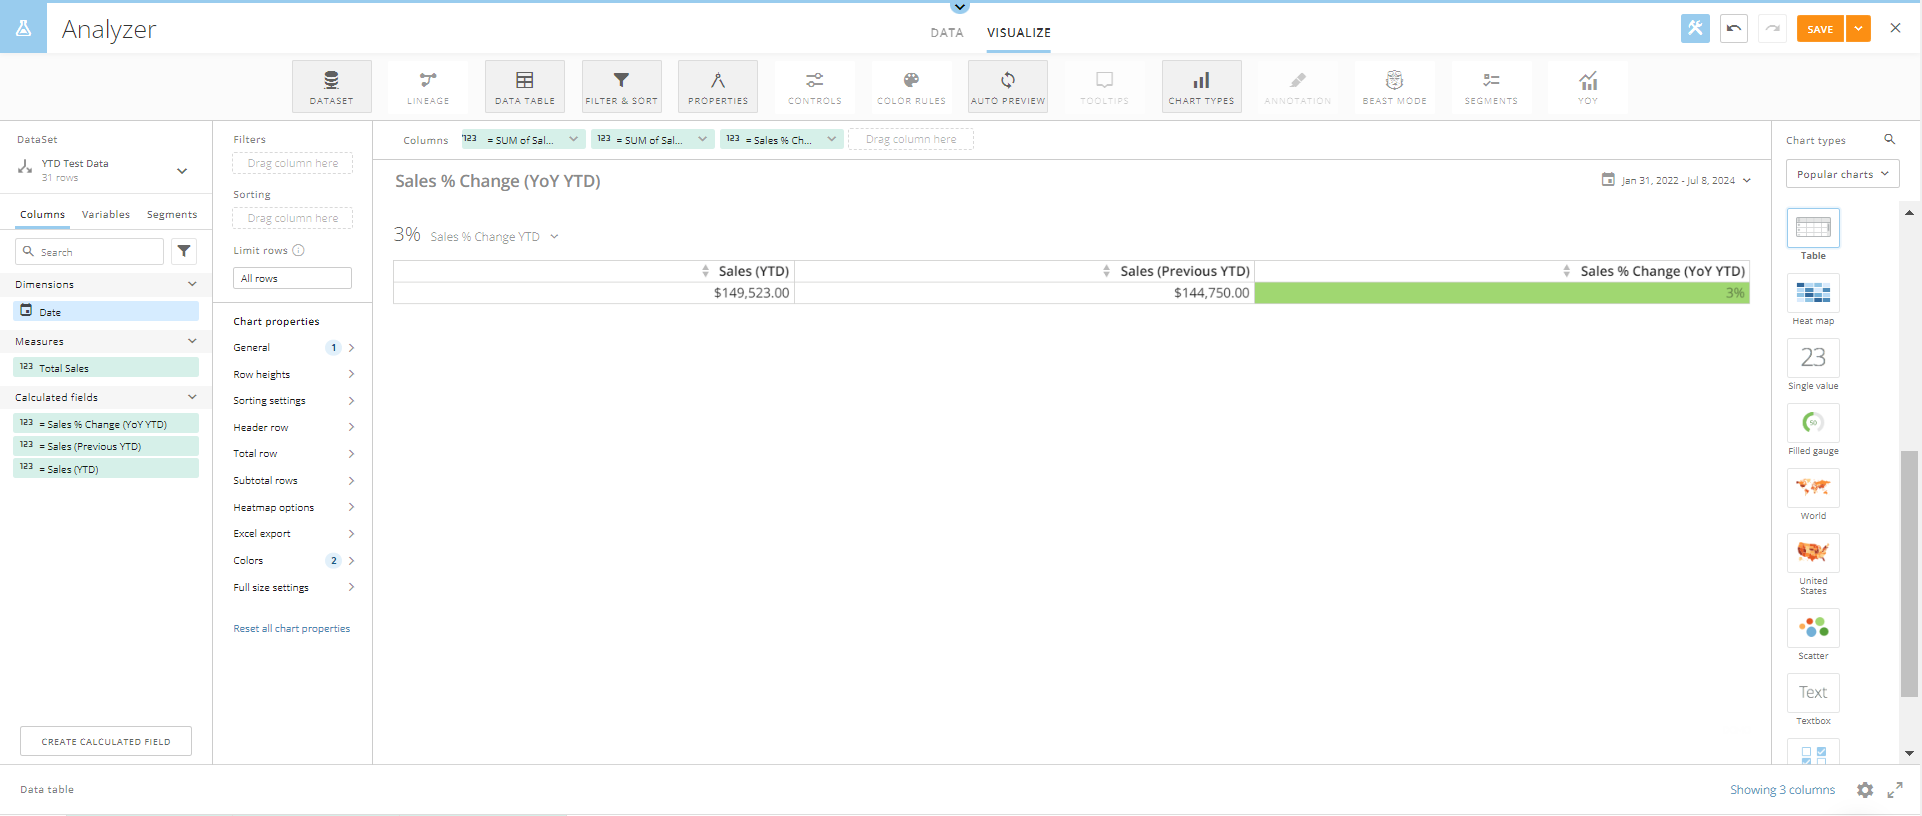
Period-over-period calculations are an excellent way to compare metrics over two different time periods. For example, you might want to know how your sales are trending in the current year-to-date versus the previous year-to-date. You can create a table like the one shown below with Domo Beast Mode calculations.

1. Calculate Sales (YTD)
Start by calculating sales in the current year-to-date using this Beast Mode formula:
CASE
	WHEN
    		YEAR(`Date`)=YEAR(CURDATE())
        		THEN `Total Sales`
END
Save that calculation and name it “Sales (YTD)”.
2. Calculate Sales (Previous YTD)
Calculate sales in the previous year-to-date using this Beast Mode formula:
CASE
	WHEN
       		 ((YEAR(`Date`)=YEAR(CURDATE())-1))
       		 AND DAYOFYEAR(CURDATE()) >= DAYOFYEAR(`Date`)
        		THEN `Total Sales`
END
Save that calculation and name it “Sales (Previous YTD)”.
3. Calculate Sales % Change (YoY YTD)
We can calculate the year-over-year percent change easily by referring to our Sales (YTD) and Sales (Previous YTD) calculations in our new percent change formula. Using nested Beast Modes, Domo allows you to refer to previously created calculations in a new calculation by simply entering the names of the previously created formulas.
Calculate the year-over-year percent change in sales YTD using this Beast Mode formula:
((SUM(`Sales (YTD)`))
 -
(SUM(`Sales (Previous YTD)`)))
/
(SUM(`Sales (Previous YTD)`))
Save that calculation and name it “Sales % Change (YoY YTD)”.
You now have everything you need to create a table with Sales (YTD), Sales (Previous YTD), and Sales % Change (YoY YTD) as shown above.
Other Period-Over-Period Calculations
Want guidance on other period-over-period calculations? Check out Domo’s guide to period-over-period Beast Modes.
Categorization Calculations
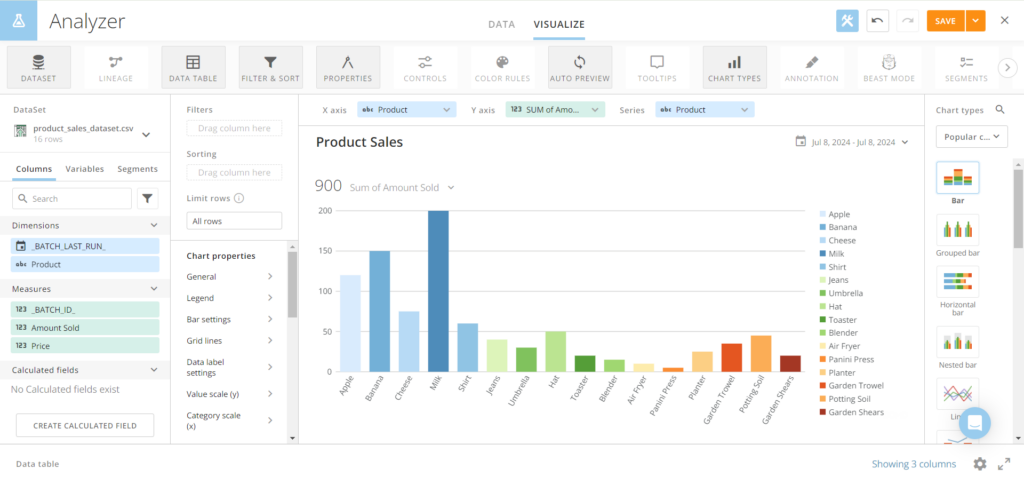
Domo Beast Mode calculations can additionally be used to categorize or group data. For example, you might have sales data by product (as shown in the graph below) but want to group products into product categories. You might additionally want to group product categories into divisions.

1. Group Products into Product Categories
Start by grouping your products into product categories using a formula similar to this Beast Mode:
CASE

        WHEN `Product` = 'Apple' THEN 'Fruit'
    	WHEN `Product` = 'Banana' THEN 'Fruit'

   	WHEN `Product` = 'Cheese' THEN 'Dairy'
    	WHEN `Product` = 'Milk' THEN 'Dairy'

    	WHEN `Product` = 'Shirt' THEN 'Outerwear’
        WHEN `Product` = 'Jeans' THEN 'Outerwear'

    	WHEN `Product` = 'Umbrella' THEN 'Accessory'
    	WHEN `Product` = 'Hat' THEN 'Accessory'

    	WHEN `Product` = 'Toaster' THEN 'Appliance'
    	WHEN `Product` = 'Blender' THEN 'Appliance'
    	WHEN `Product` = 'Air Fryer' THEN 'Appliance'
    	WHEN `Product` = 'Panini Press' THEN 'Appliance'

    	WHEN `Product` = 'Planter' THEN 'Garden'
    	WHEN `Product` = 'Garden Trowel' THEN 'Garden'
    	WHEN `Product` = 'Potting Soil' THEN 'Garden'
    	WHEN `Product` = 'Garden Shears' THEN 'Garden'

    	ELSE 'Other'

END
Save that calculation and name it “Product Category”.
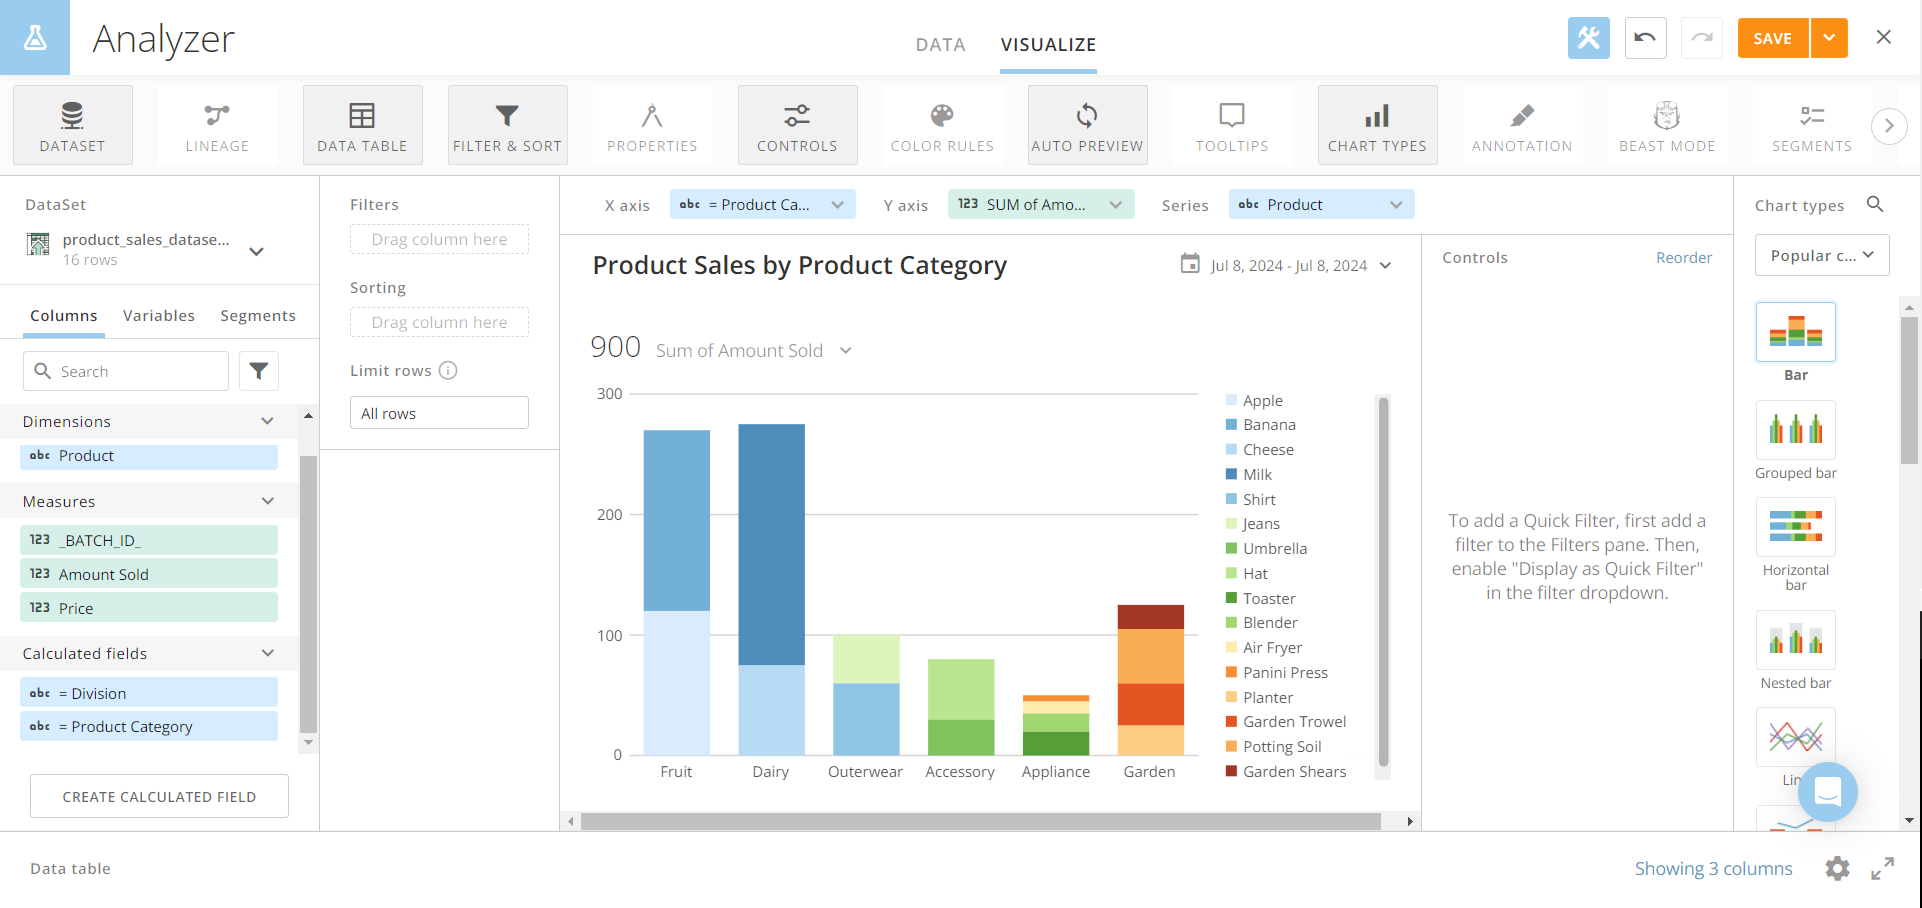
You can then create a graph (like the one shown below) that shows a more concise picture of where your sales are coming from.

2. Group Product Categories into Divisions
Using your already created “Product Category” Beast Mode, you can group your product categories into divisions. The Beast Mode formula should be similar to this:
CASE

	WHEN `Product Category` = 'Fruit' THEN 'Grocery'
    	WHEN `Product Category` = 'Dairy' THEN 'Grocery'

    	WHEN `Product Category` = 'Outerwear' THEN 'Clothing'
    	WHEN `Product Category` = 'Accessory' THEN 'Clothing'

    	WHEN `Product Category` = 'Appliance' THEN 'Home and Garden'
    	WHEN `Product Category` = 'Garden' THEN 'Home and Garden'

    	ELSE 'Other'

END
Save that calculation and name it “Division”.
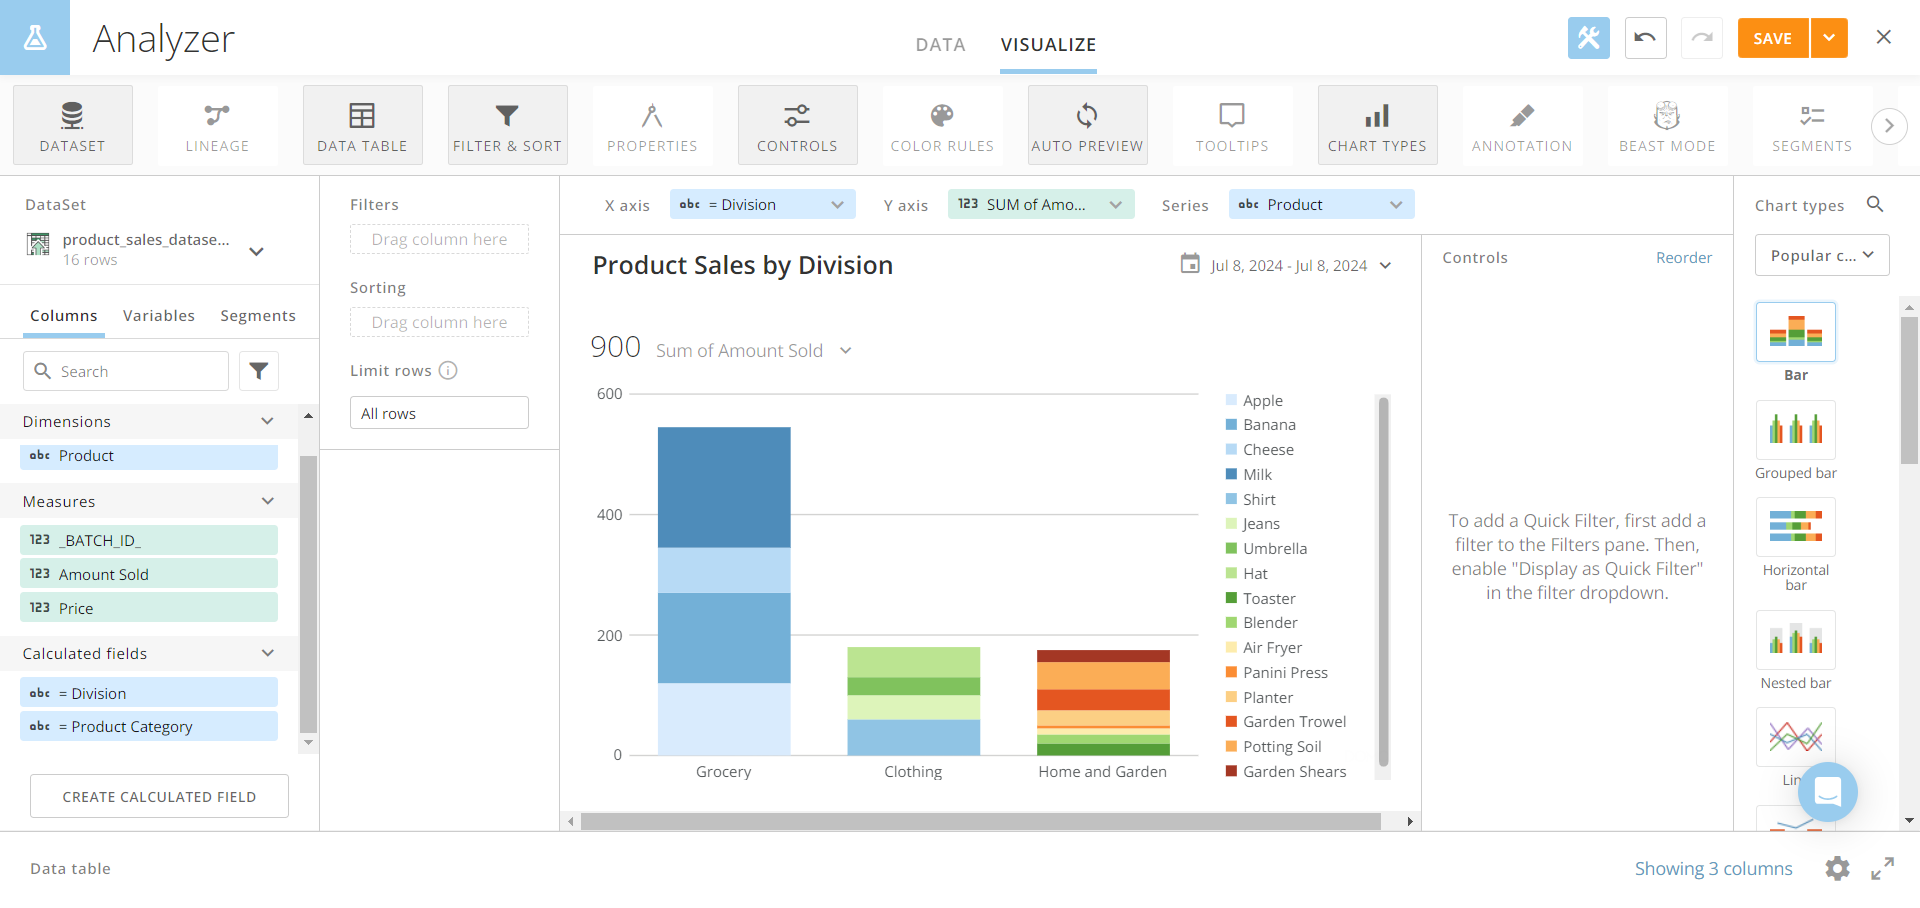
You can then create a graph (like the one shown below) that allows you to see your sales rolled up by division.

Beast Modes and Domo AI
With Domo AI constantly evolving, it’s no surprise that it can now help you create Beast Modes. Thanks to Domo’s new AI Playground, you can use the Text-to-Beast Mode service to generate Beast Modes from natural language prompts. Want to learn how to get started? Check out our Domo AI: Text-to-Beast Mode Overview blog post.
Conclusion
Domo Beast Mode is an exceptional tool that can truly help bring your data manipulations to the next level. These are just a few of the Beast Mode calculations you can create.
Interested in what other members of the Domo community are working on in Beast Mode? Check out Domo’s Beast Mode Community Forum.
Need additional help creating Beast Modes? Check out our Domo consulting services today!

