Domo offers a wide range of built-in visualizations, making it easy to customize how you display your data. But sometimes, even with all these options, you need something more tailored to your specific needs. That’s where Domo Bricks come in.
Domo Bricks are powerful, customizable apps that let you build your own visualizations within Domo, taking your dashboards to the next level. Available in the Domo Appstore, they give you full control, whether you’re adjusting the look and feel of your charts or creating fully interactive data experiences. With Domo Bricks, the power to design unique, dynamic visualizations is in your hands.
Getting Started with Domo Bricks
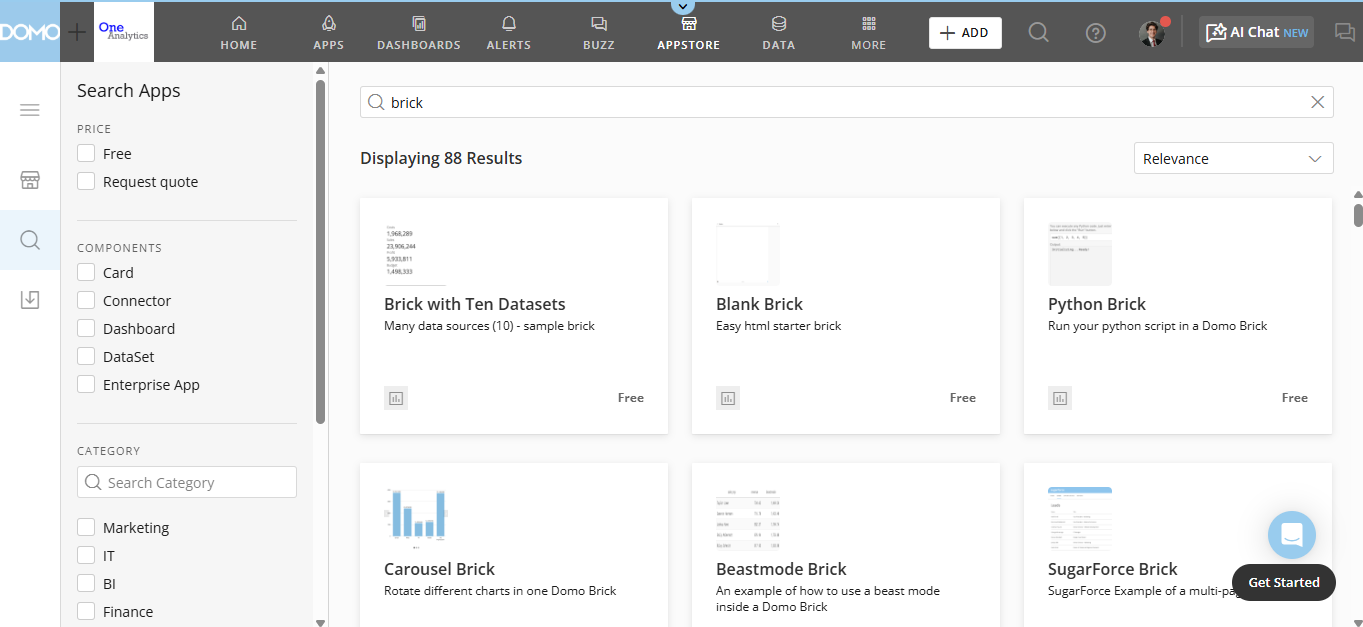
To start building your own brick, navigate to the Domo Appstore. Simply search for “Brick,” and you’ll find a collection of over 80 pre-built Domo Bricks, ready to download and customize.

Once you’ve selected a brick to start with, click on it in the Domo Appstore, then click “GET” to add it to your instance. Keep in mind that each brick comes with a sample dataset, which will automatically run upon installation. This process consumes a small number of Domo credits, so it’s something to be aware of before getting started.
What Makes Up a Domo Brick?
A Domo Brick is built using three core coding components: JavaScript, HTML, and CSS. Each plays a distinct role in how the brick functions and appears within your dashboard.
JavaScript handles the dynamic functionality of your brick, bringing it to life with interactive elements, animations, and real-time updates. Think of it as the construction crew that builds your visualization, whether it’s a simple bar chart or a fully interactive data experience.
HTML provides the structural framework for your visualization, similar to the foundation of a building. It determines where elements appear on the page and establishes the layout that will house your new creation.
CSS controls the styling and visual design, allowing you to customize colors, fonts, spacing, and overall aesthetics. Like a fresh coat of paint on a house, CSS ensures your visualization looks polished and matches your dashboard’s branding.
By combining these three elements, Domo Bricks give you complete flexibility to create unique, customized visualizations tailored to your specific data needs.
Tips for New Domo Bricks Users
With Domo Bricks, the customization possibilities are nearly endless. While this flexibility is powerful, it can also make it challenging for new users to know where to start. Based on our experience, here are a few key tips to help you build your first Domo Brick smoothly.
1. Find a Good Starting Point
Instead of building from scratch, start with a brick that closely matches your desired outcome. This provides a solid foundation and makes the customization process easier. For example, if you’re looking to add dynamic or animated elements, consider using the D3 Ranked Animated Bars Brick as your base.
However, if your design is highly custom and doesn’t align well with existing bricks, it may be more efficient to start with Domo’s Blank Brick and reference pre-built code as needed.
2. Replace Sample Datasets
Since bricks are designed to visualize data, they reference datasets using aliases. Every brick, including the Blank Brick, comes with a sample dataset to demonstrate its functionality.
If a referenced dataset is deleted, the brick will stop working entirely, and any custom code you’ve written inside it will be lost. To prevent this, replace the sample dataset with your actual dataset as soon as possible. If you want to keep the sample data while building, consider renaming it to prevent accidental deletion by other users.
Check out the video below to see how to replace sample datasets within a brick.
3. Preview Your Brick in Its Final Environment
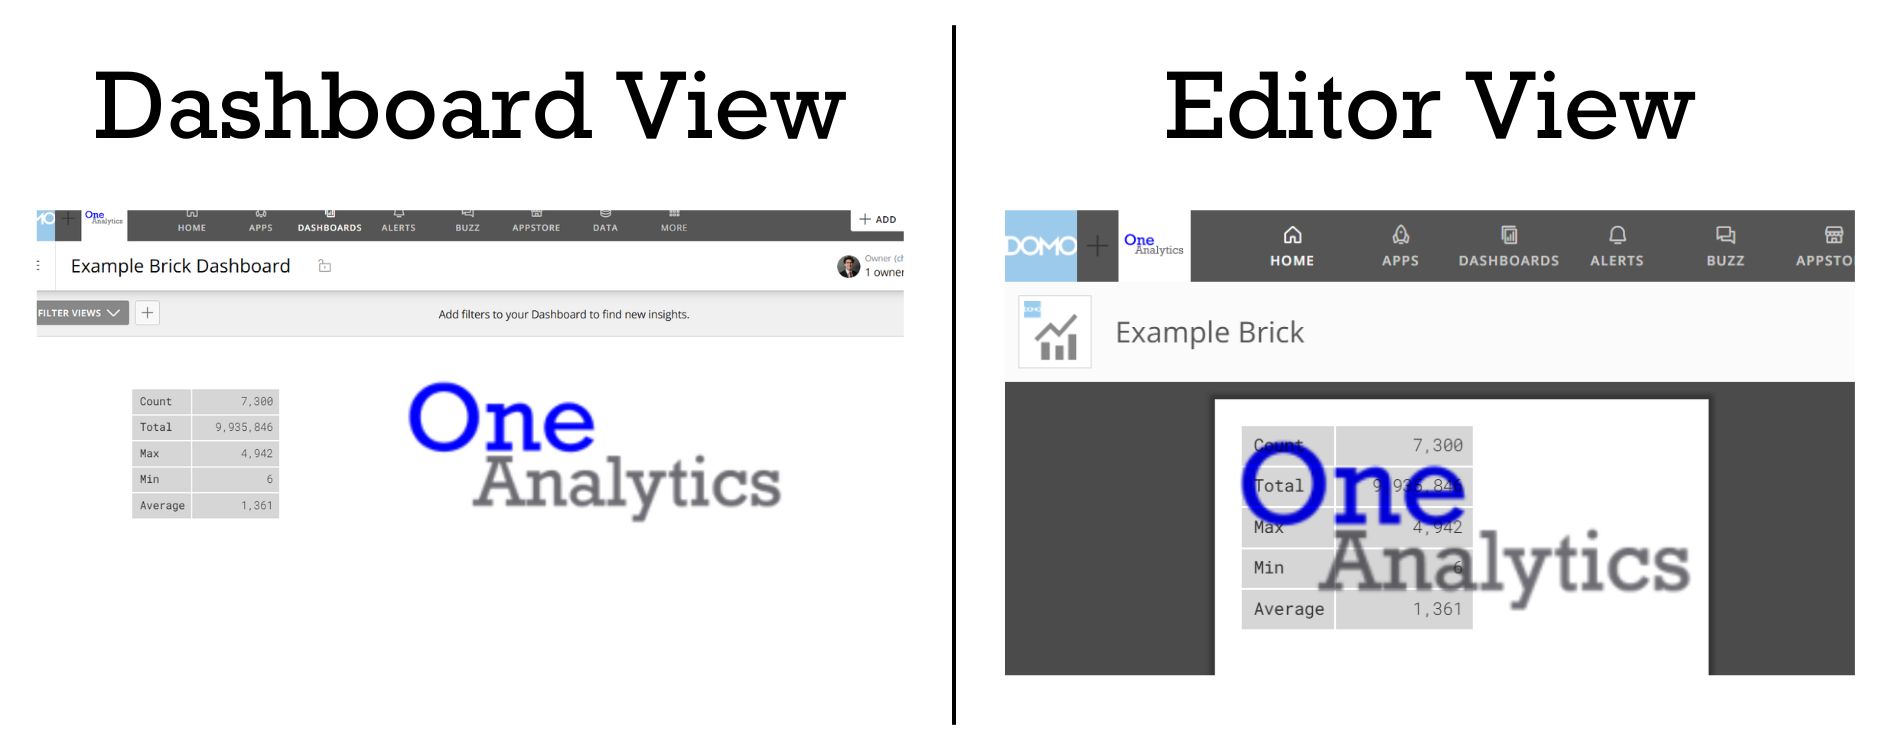
The editor’s preview window is much smaller than how the brick will actually appear in a Domo dashboard or app. Because of this, certain elements (e.g. axis titles) may look misaligned in the editor but appear correctly in the full dashboard or app view. See an example of this in the snips below.

To ensure your visualization appears as intended, regularly preview your brick in the environment where it will ultimately live, whether that is a dashboard or app. Each environment may display your brick differently, so it’s important to tailor the layout and sizing accordingly. Previewing often will help you spot any display issues early and make adjustments throughout the editing process.
4. Use AI to Design and Debug Faster
Generative AI (e.g. ChatGPT) can be a great tool for customizing and troubleshooting bricks. You can even upload a hand-drawn sketch of your desired layout or interaction. This gives AI a visual reference to better understand your intent and turn your idea into functional code more quickly and accurately.
If something within the brick isn’t working as expected, open your browser’s developer console to check for error messages. To do this, right-click anywhere on the page, select “Inspect”, and switch to the “Console” tab. Taking screenshots of error messages and sharing it with the AI tool can enable it to provide quick, targeted help.
Whether you’re designing or debugging, leveraging AI can streamline the brick building process and make it feel a lot less intimidating.
Conclusion
Domo Bricks give you the power to create fully customized, interactive data visualizations that go beyond standard charts and graphs. With endless flexibility, you can design visualizations tailored to your exact needs, bringing your dashboards to life in new and impactful ways.
Ready to get started with Domo Bricks or need expert guidance? Explore our Domo consulting services to see how we can help and contact us today!
Editor’s note: Ethan Eversole wrote the original version of this post in March 2025. Brigitte Bussiere updated the post in July 2025.

