Looker Studio (formerly Google Data Studio) and Domo are both popular business intelligence (BI) platforms that give you the ability to visualize data through custom dashboards. However, it can be tricky deciding which platform will work best for your company. We’ve broken down several key categories to determine the best platform for your needs.
Connecting Data
Looker Studio has 24 pre-built Google connectors that make it easy to connect to data within the Google ecosystem (e.g. Google Analytics, Google Ads, Google Search Console, BigQuery, etc.). Looker Studio additionally offers over 1,000 partner connectors to help you connect your data that lives outside of Google’s ecosystem. Some of these partner connectors require a subscription to an intermediary tool like Supermetrics to move data from where it resides (e.g., a CRM, advertising platform, etc.) into a Looker Studio report. You can additionally build your own community connector, but the process requires coding knowledge.
Domo has a wide variety of connectors that make it simple and fast to import your data. With over 1,000 pre-built connector options, bringing data into Domo is a nonissue regardless of where it resides. If you can’t find what you’re looking for, Domo gives you the ability to create your own custom connector.
Cleaning & Combining Data
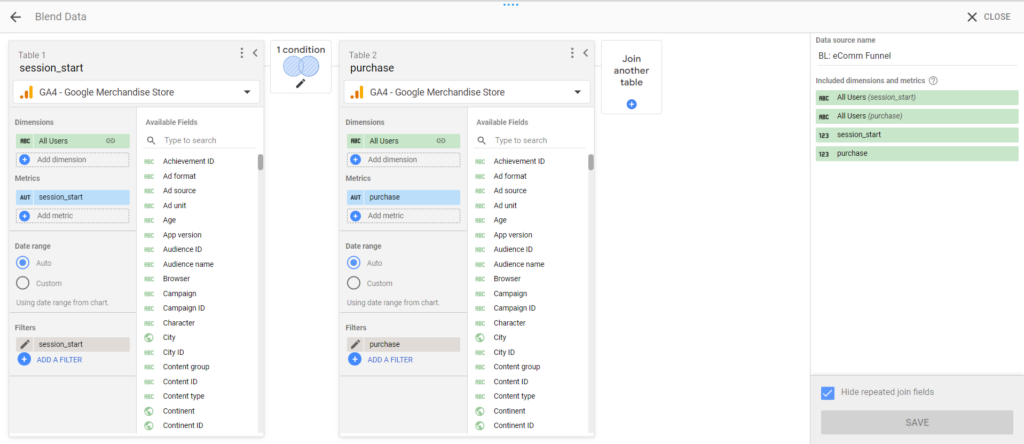
Looker Studio allows you to do basic cleaning (e.g. retitling columns, switching the data type, creating calculated fields, etc.). You can additionally combine datasets easily within Blends (shown in the image below). You can blend up to five datasets together using join statements. The modest availability of cleaning functions and the limited number of datasets that can be combined makes data transformations more difficult in Looker Studio. Therefore, you should try to clean your data as much as possible before pulling in your dataset.

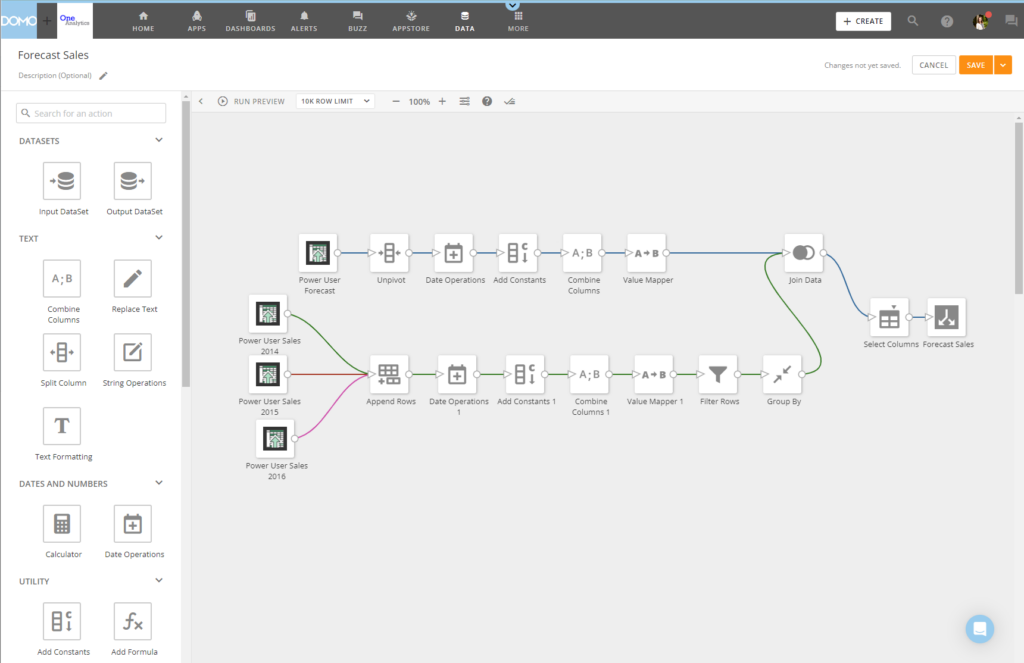
Domo allows you to clean and combine your data more comprehensively through Magic ETL (shown in the image below). Magic ETL gives you the power to retitle columns, switch the data type, create calculated fields, pivot or unpivot data, delete duplicate rows, and much more. There are no limits on the number of datasets that can be appended or joined, allowing you to create an all-encompassing dataset. You can additionally add in code for advanced transformations using the R and Python tiles.

Visualizing Data
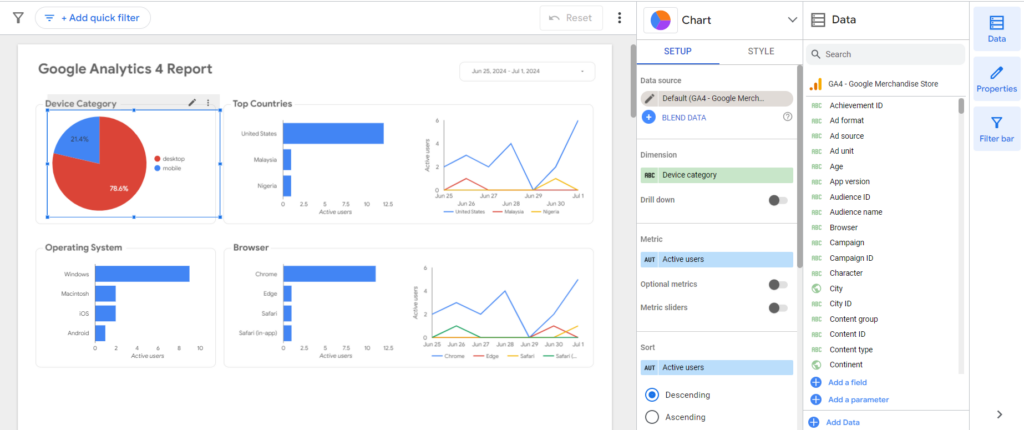
Looker Studio provides a wide range of visualization options in an easy drag-and-drop interface (shown in the image below). There are 48 visualization types including line graphs, bar graphs, maps, and more. Each visualization option is fully customizable with axis labels, scale, colors, and font, allowing you to make each visualization your own. You can additionally use community visualizations that are created by third-party developers in Looker Studio. Community visualizations can allow you to showcase your data in more custom ways. However, you should carefully review the code and functionality of community visualizations to mitigate risks associated with third-party development.

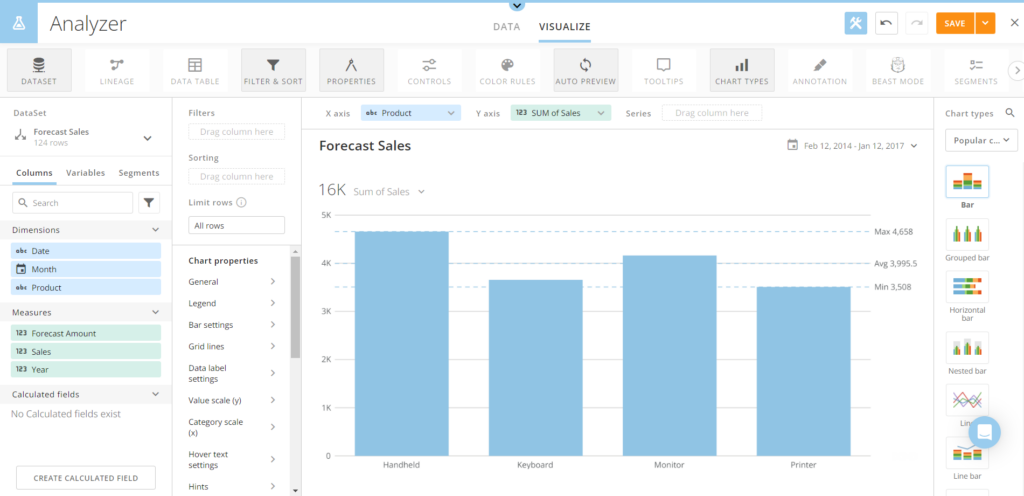
Domo offers a diverse array of visualizations that can be created and fully customized within Analyzer (shown in the image below). With over 150 chart types, it is easy to find a visualization that works for you. However, if you want a very custom visualization, Domo additionally allows you to create your own custom chart type.

Analyzing Data
Looker Studio allows you to consolidate and visualize your data into easy to analyze dashboards. Dashboards can be composed of multiple pages, each dedicated to a specific topic or data set. Sharing a dashboard with a team is easy, and your team can make the report their own with dynamic filters.
Similarly, Domo allows you to display your data in dashboards that are easy to create and share. Beyond its dashboard features, Domo includes numerous data science tools. Within Magic ETL, Domo offers 6 data science tiles including: Classification, Clustering, Forecasting, Multivariate Outliers, Outlier Detection, and Prediction. You can additionally incorporate your own Python and R scripts to perform analyses in Magic ETL.
Price
Looker Studio is a free platform. (There is a paid version, Looker Studio Pro, that is not covered in this blog post but offers some additional capabilities and additional support for $9 per user per project per month.) When considering the cost to implement Looker Studio, you should consider the cost of third-party connectors (e.g. Supermetrics) that you may need to use to pull data into your reports as they can add up quickly.
Domo uses a consumption-based pricing system. You receive a certain number of credits (based on your plan) and use those credits to store, ingest, and transform data. Domo offers a 30-day free trial that allows you to test out the platform and see if it fits your needs. The trial doesn’t require a payment method. After the trial, you can contact Domo’s sales team to find a consumption plan that works for you.
All pricing information is accurate at the time of this post. For full updated details regarding Looker Studio pricing, please refer to Looker Studio’s website. For full updated details regarding Domo’s pricing, please refer to Domo’s website.
Conclusion
Domo and Looker Studio can both help your business to make data driven decisions, but their features cater to organizations with different needs.
We recommend using Looker Studio if:
- You want to report on data that is within the Google ecosystem (e.g. Google Analytics, Google Search Console, Google Ads, etc.).
- You don’t need to do significant data cleaning / combination.
- You want basic data visualization types.
- You don’t want to conduct in-depth analysis and data science efforts within the platform.
We recommend using Domo if:
- You are looking to connect to data wherever it resides (inside the Google ecosystem or not).
- You need to do significant data cleaning / combination.
- You want a wide variety of visualizations.
- You want to conduct in-depth analysis and data science efforts within the platform.
Looking for help setting up Looker Studio or Tableau? Reach out to our team of Looker Studio and Domo experts today.

