We’re taking a look at Tableau vs Domo. These two powerful business intelligence (BI) platforms offer a range of features designed to help you visualize your data. Before you begin your data journey, here’s a comprehensive assessment of each platform.
Connecting Data
Tableau supports over 90 connectors. You can find additional partner-built connector options in the Tableau Exchange. You can additionally build your own connector using the Tableau Connector SDK.
Alternatively, Domo offers over 1000 pre-built connectors in the Domo Appstore. This wide variety provides a comprehensive solution for seamlessly integrating and connecting diverse data sources. If you can’t find the connector you need, Domo gives you the ability to create your own custom connector.
Cleaning & Combining Data
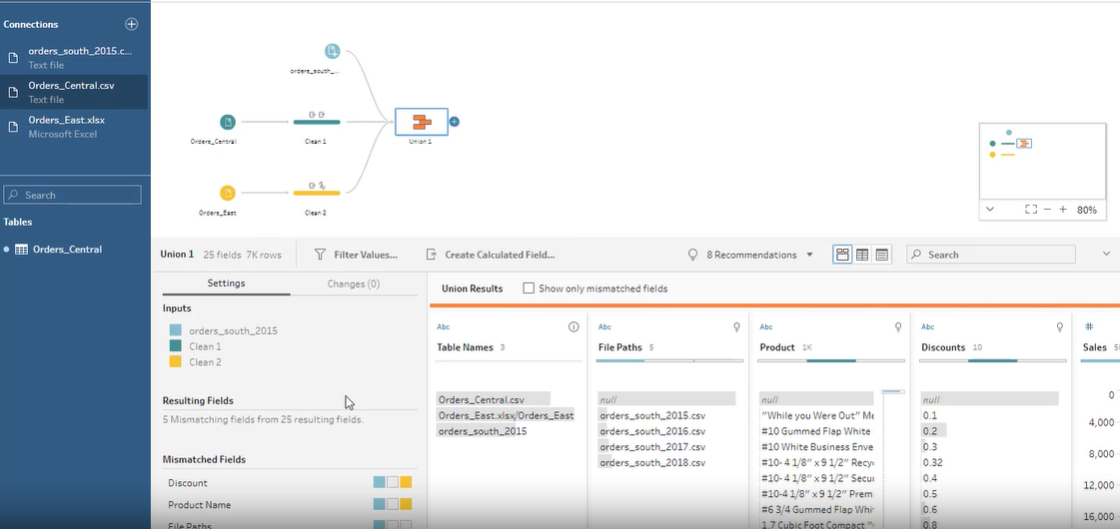
Tableau allows you to clean and combine data through Tableau Prep Builder (shown in the image below). This tool gives you the power to remove nulls and duplicates, split fields, filter, replace values, create calculated fields and much more. In regards to data fusion, Prep Builder’s “Union” tile gives users the ability to append up to ten data sources with similar fields. You can additionally use the “Join” tile to combine datasets via a join. Within Prep Builder, users can code in Python and R using custom scripts. Although Prep Builder offers a variety of cleaning and combining functions, the tool sometimes has processing delays. It is advisable to allocate sufficient time to create and run flows.

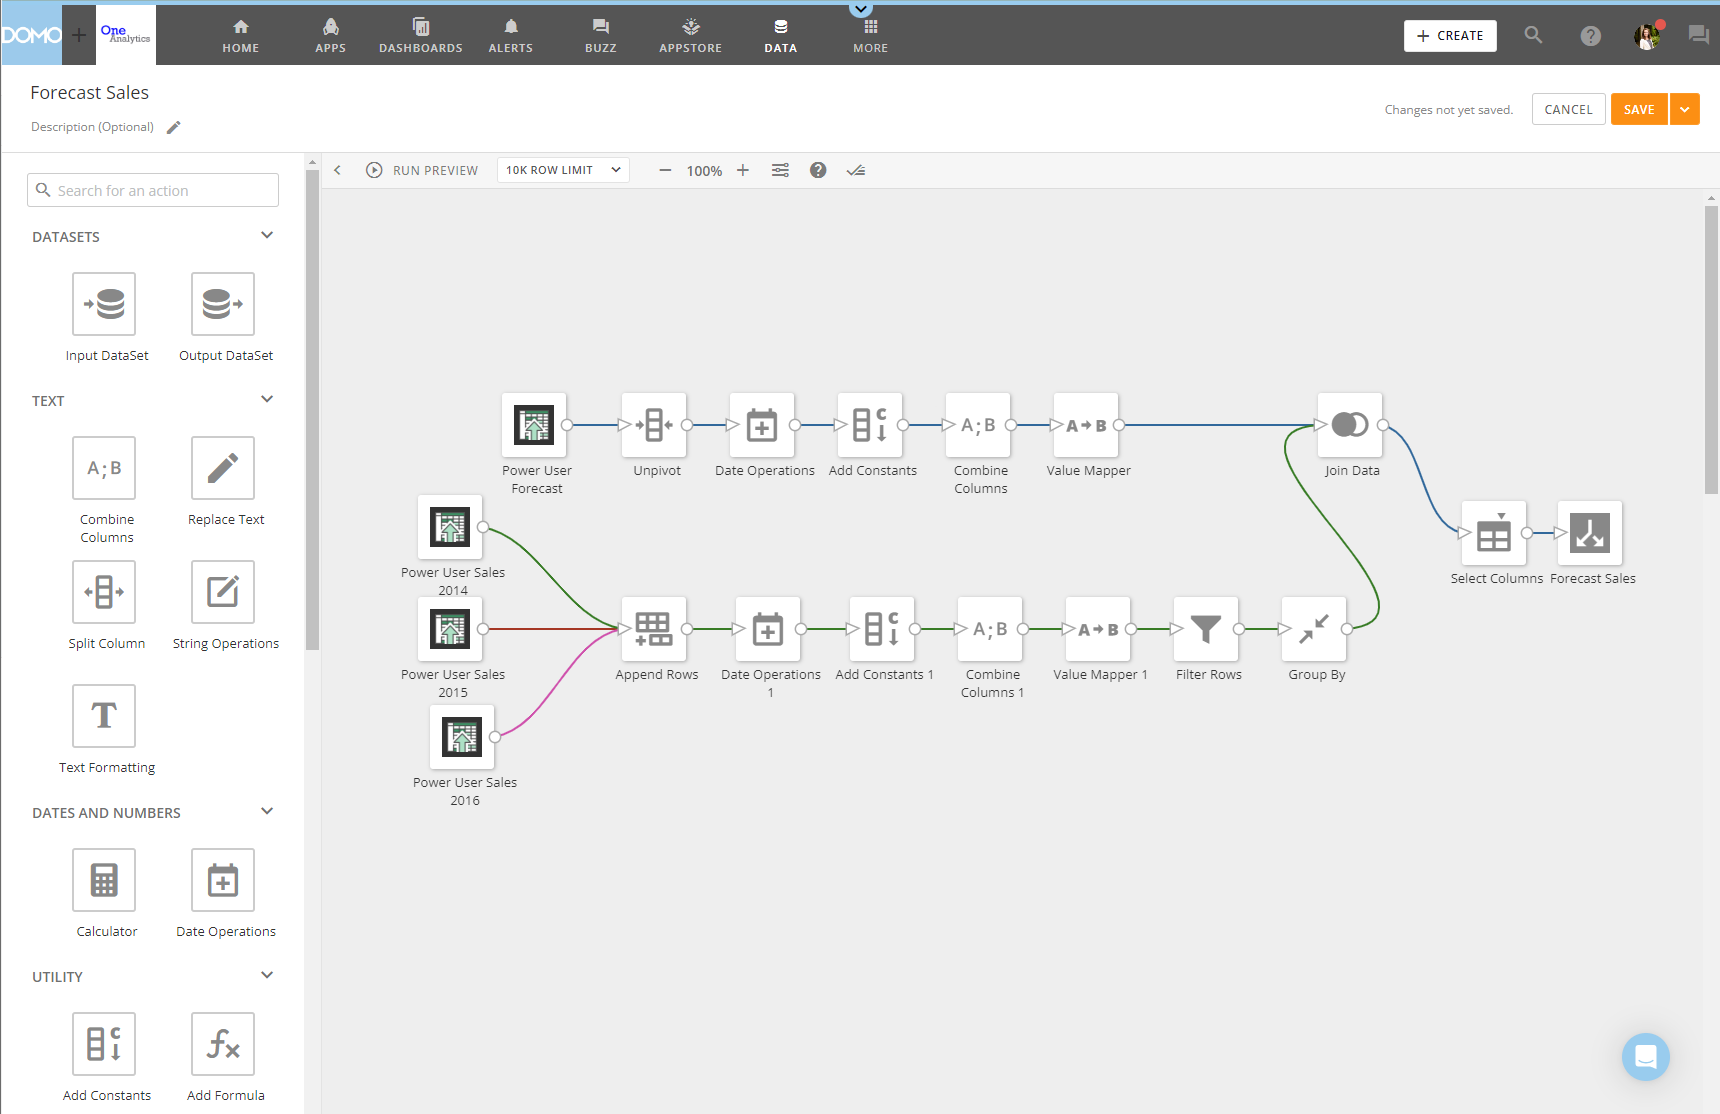
Domo allows you to clean and combine your data more comprehensively through Magic ETL (shown in the image below). Magic ETL gives you the power to retitle columns, switch the data type, create calculated fields, pivot or unpivot data, delete duplicate rows, and much more. There are no limits on the number of datasets that can be appended, allowing you to create an all-encompassing dataset. You can additionally add in code for advanced transformations using the R and Python tiles. Domo’s Magic ETL tool operates at a swift pace, allowing you to focus on analyzing and gaining insights from your data.

Visualizing Data
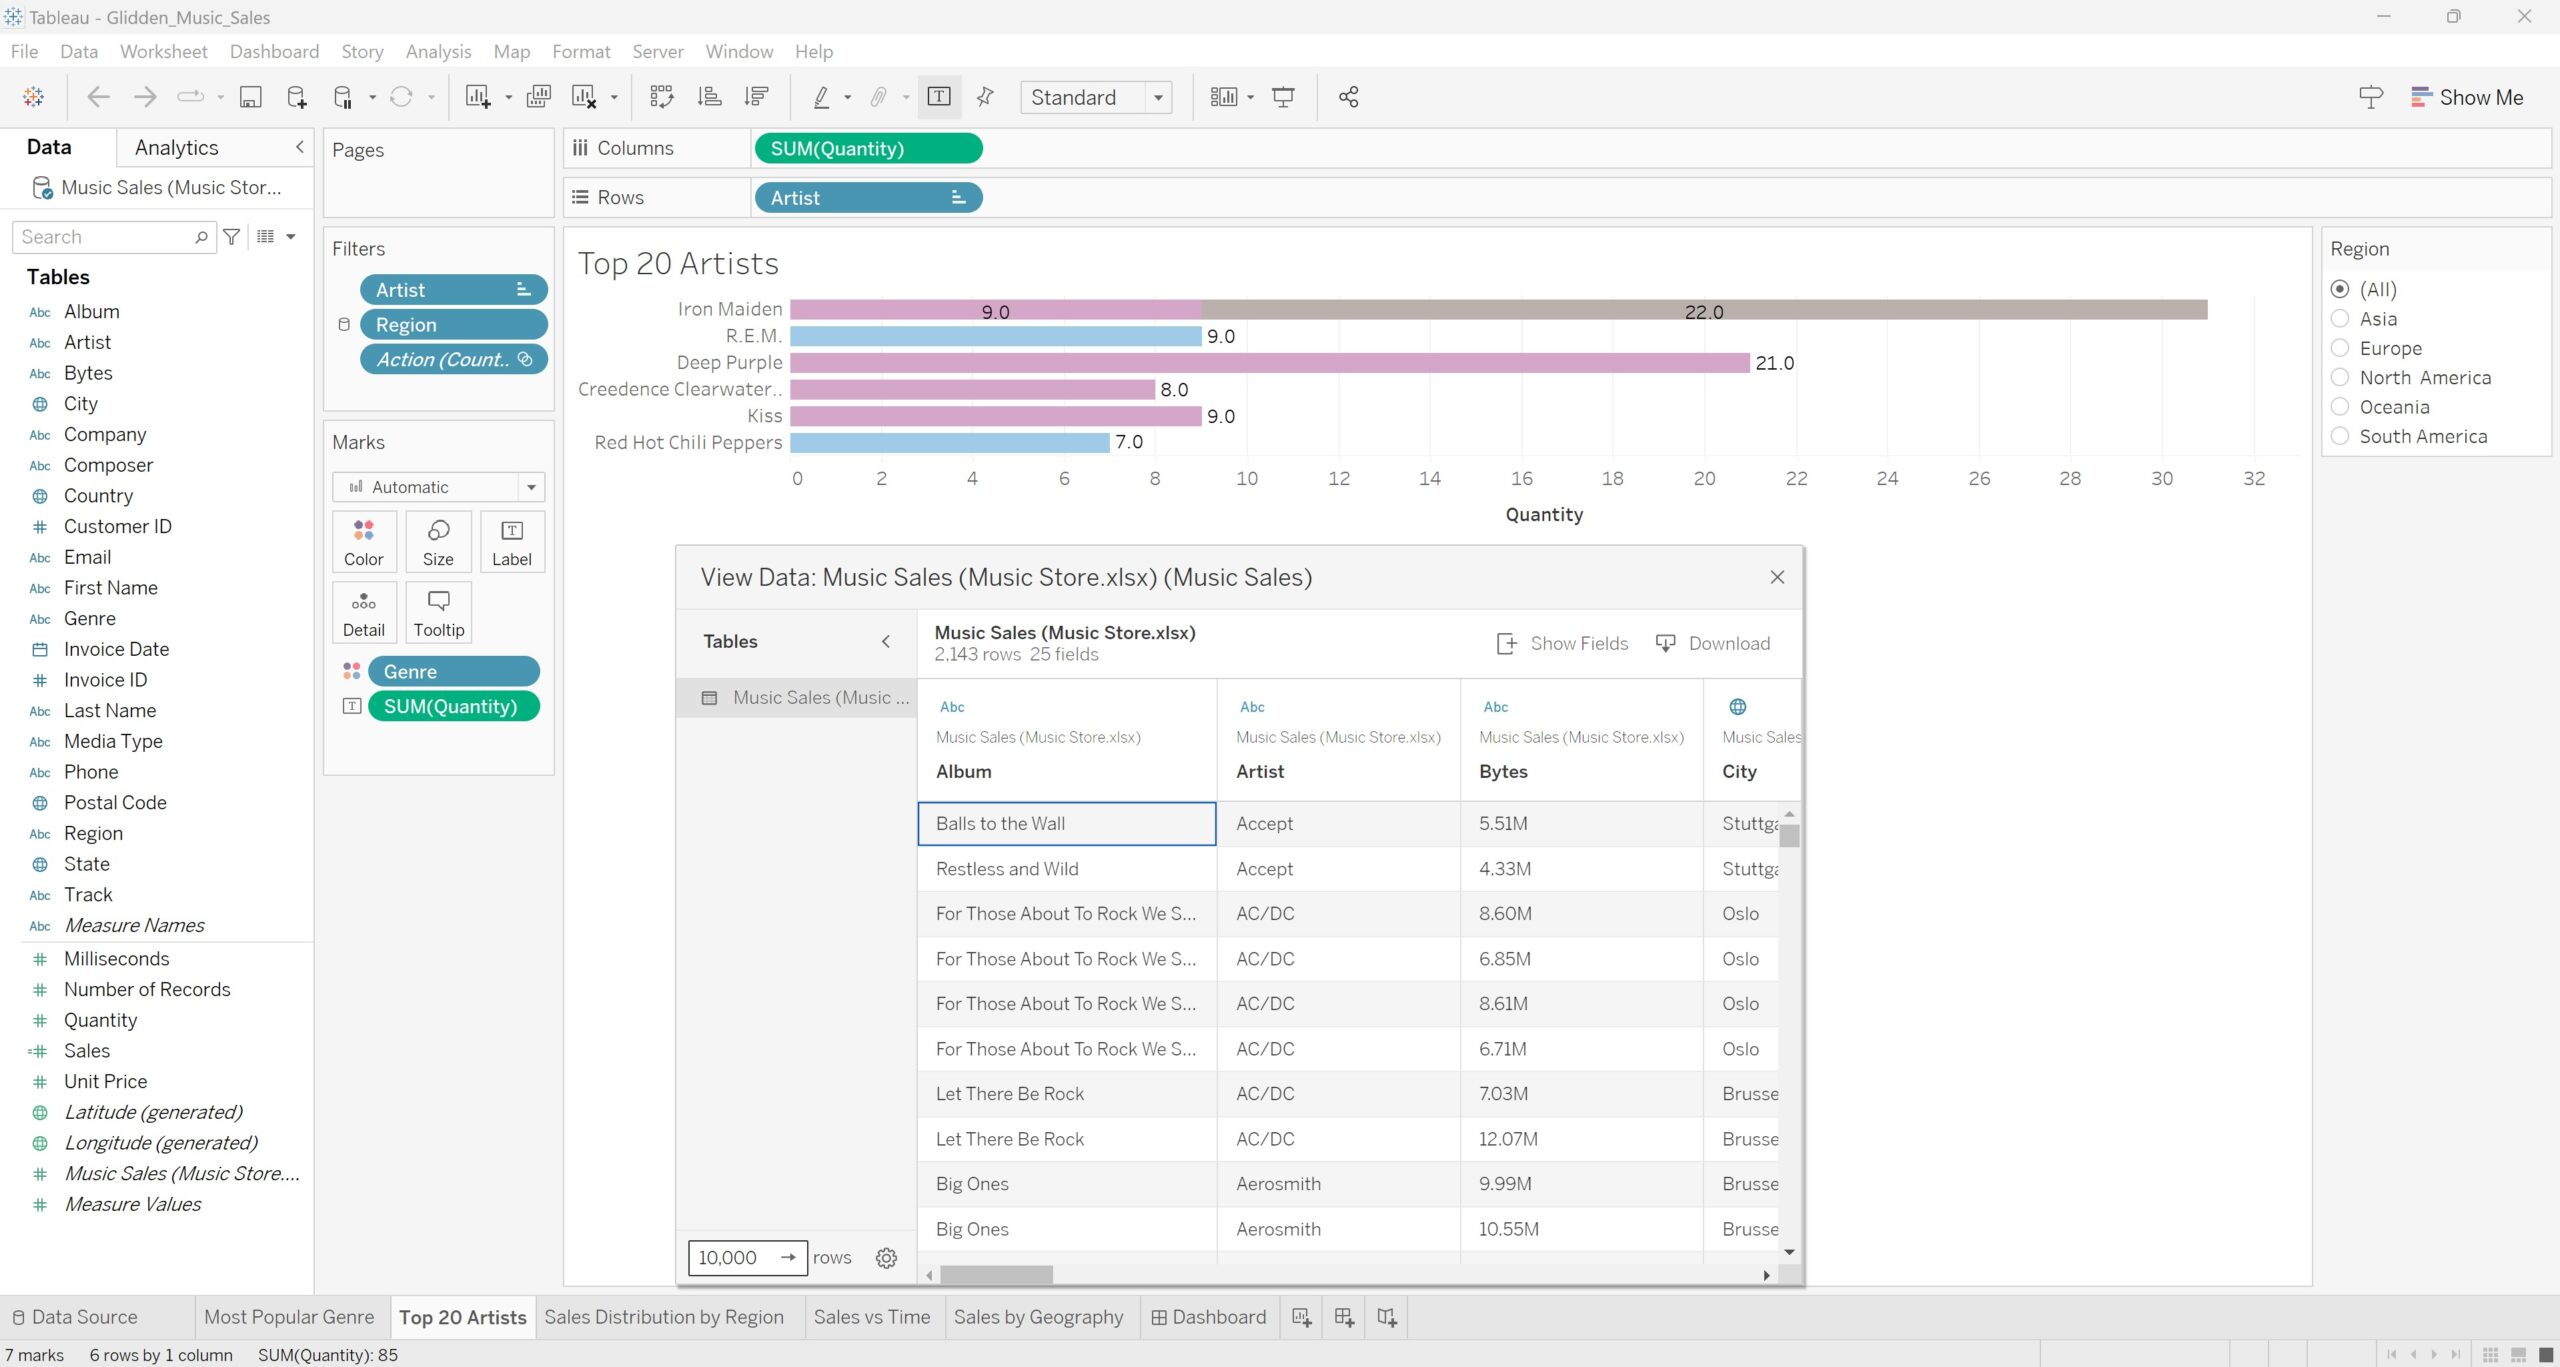
Tableau offers 60 unique visualizations. Within a Tableau worksheet (shown in the image below), you can make each visualization your own with customizable axis labels, colors, filters, tooltips, and more.

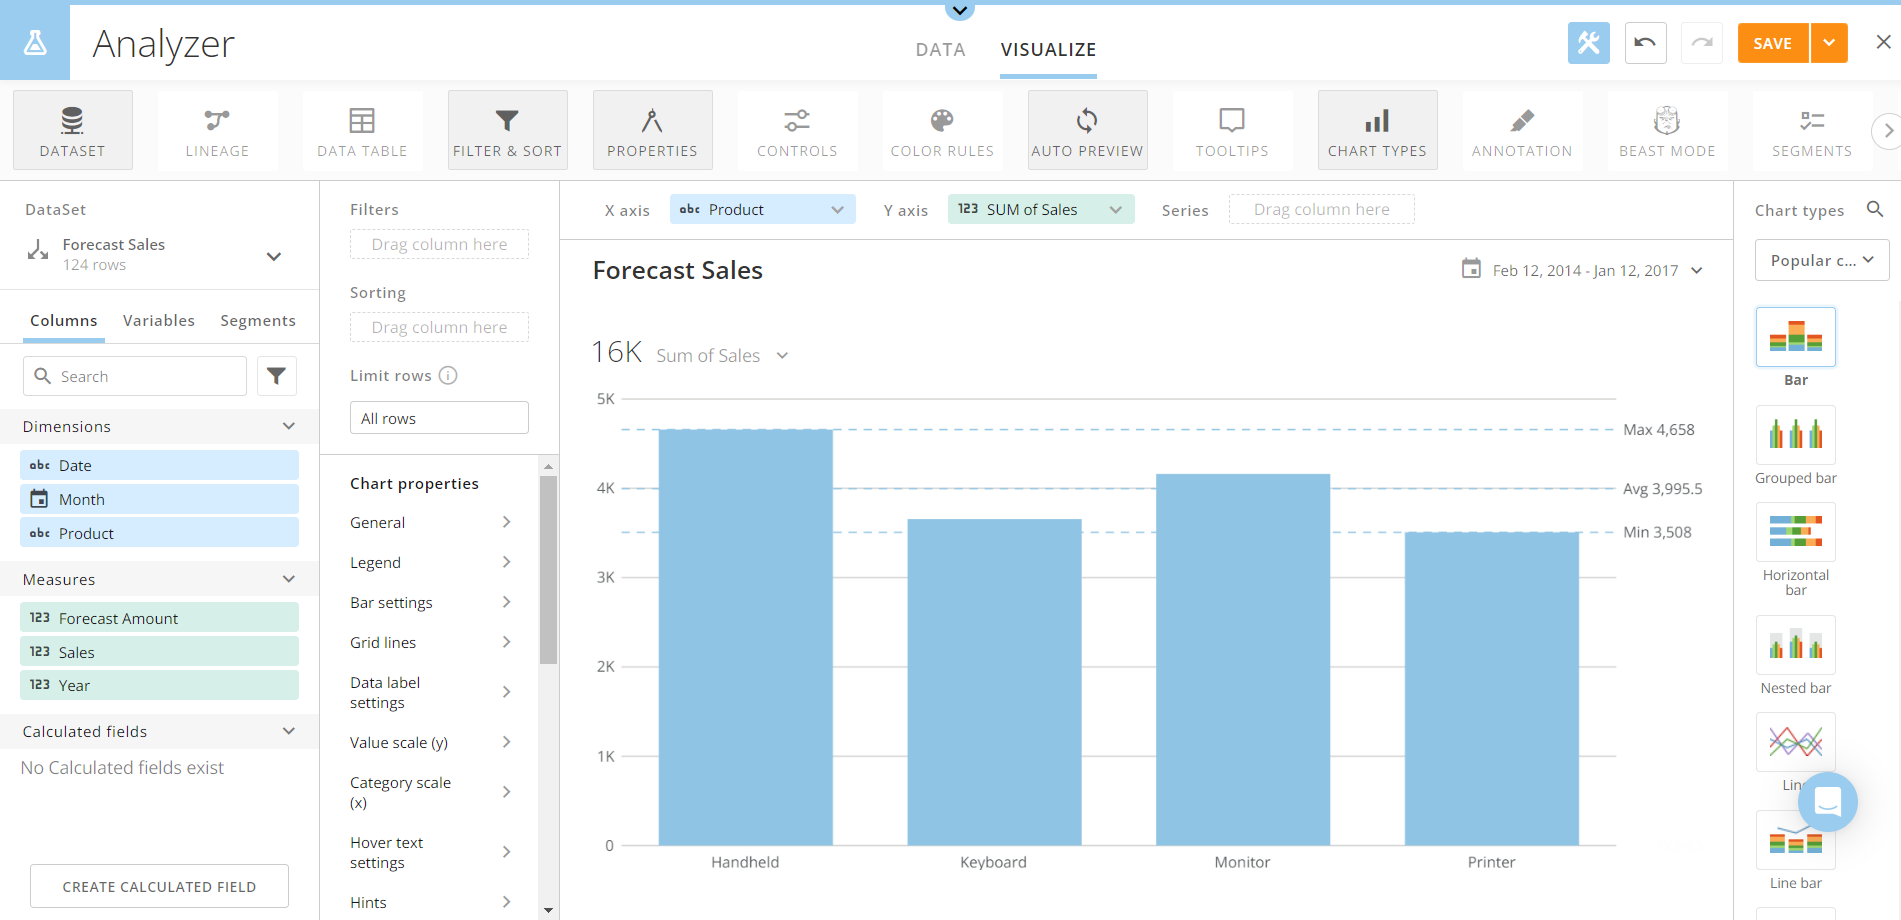
Domo offers a 150 chart types that can be created and fully customized within Analyzer (shown in the image below). Additionally, if you want a unique visualization, Domo allows you to create your own custom chart type.

Analyzing Data
Tableau allows you to consolidate and visualize your data in dashboards. Tableau’s dashboards are highly customizable with interactive legends, annotations, and more. Those who are newer to BI platforms may initially find it difficult to configure their Tableau dashboard due to the wide variety of tools and elements. For more advanced analysis, you can leverage Tableau Pulse, Tableau’s new addition to their AI suite. Tableau Pulse’s insight platform offers tailored alerts and insights using generative AI.
Domo allows you to display your data in dashboards that are easy to create and share. Beyond its dashboard features, Domo’s AI capabilities can help you get the most out of your data with generative AI. Additionally, Domo offers numerous data science tools. Within Magic ETL, Domo offers 6 data science tiles including: Classification, Clustering, Forecasting, Multivariate Outliers, Outlier Detection, and Prediction.
Price
Tableau offers 3 distinct package types: Tableau, Enterprise, and Tableau+. This blog focuses on the Tableau plan. Within the Tableau package, there are three different license types: Creator, Explorer, and Viewer. This blog focuses on what you can do with a Creator license. Tableau Creator costs $75 / user / month, and it includes Tableau Prep Builder, Tableau Desktop, and Tableau Pulse. When signing up, you can additionally choose to host your Tableau instance on Tableau Cloud or Tableau Server.
Domo uses a consumption-based pricing system. You receive a certain number of credits (based on your plan) and use those credits to store, ingest, and transform data. Domo offers a 30-day free trial that allows you to test out the platform and see if it fits your needs. The trial doesn’t require a payment method. After the trial, you can contact Domo’s sales team to find a consumption plan that works for you.
All pricing information is accurate at the time of this post. For full updated details regarding Tableau pricing, please refer to Tableau’s website. For full updated details regarding Domo’s pricing, please refer to Domo’s website.
Conclusion
Tableau and Domo are both powerful BI tools that bring static data to life, but each platform suits different needs.
We recommend using Tableau if:
- You need less flexibility with connectors (i.e. Tableau already has the connector you need pre-built).
- You have more time to perform data cleaning / combination.
- You want basic visualization options.
- You want a self-hosted solution.
We recommend using Domo if:
- You are looking to connect data to wherever it resides.
- You want quick results when cleaning and combining your data.
- You want a variety of highly customizable visualization types.
- You want a cloud-hosted solution.
Looking for more information on the relative strengths of Tableau vs Domo? Want help getting Tableau or Domo implemented at your organization? Take a look at our Tableau and Domo consulting services to see how we can help you get the most from the platform you choose.

